streamoors
 IGNITION
 NEAR Protocol
 Injective
 Pearl
Pearl LayerZero
 Quantus
- BCH’s price was aiming to break out of a symmetrical triangle pattern.
- The RSI present in the bullish zone hints at the bulls’ strength.
The price of Bitcoin Cash (BCH) anticipates a breakout run in the coming trading sessions. There is a possibility that it can breach a $180 key hurdle.
The BCH price saw bullish cues from the market participants. It was evidenced by the 52% surge in trading volume during the intraday session. This reflected the growing optimism among investors and traders.
This surge in trading volume represented a bullish sign as traders anticipated a breakout move. However, the Bitcoin Cash price remained volatile around the $360 mark, and indecisiveness was observed.
Once the BCH price successfully breaks the $380 hurdle, a fresh bullish rally could send Bitcoin cash toward $400. However, a dip below the $345 mark would invalidate the bullish view. Meanwhile, the BCH crypto awaits market support and consolidates around the crucial hurdle of $370.
BCH Price Prediction: Can BCH Crypto Reach $400 This Month?
Bitcoin cash price has moved within a symmetrical triangle pattern. Meanwhile, the Bollinger band was squeezed and was edging close to unfold a massive move.
The BCH price was trading at $366.16, noting an intraday surge of over 2.30%. Its market cap rose to $7.24 Billion, and it has a total supply of 19.78 Million.
In a recent tweet by Giray, he said that BCH crypto had formed a symmetrical triangle pattern. It was close to triggering a sharp move. In case of a successful breakthrough above $380, an upswing toward $415 may be seen in the coming sessions.
The altcoin has decisively respected the 200-day EMA cluster and stayed above it, representing the buyers’ strength. For the last two months, the BCH price has been stuck in a narrow range between $300-$380 and hovers around it.
A daily close above the $380 mark would trigger a sharp potential upward movement. This could push the BCH’s price above the $400 level.
What Do Technical Indicators Say?
Looking at the price setup, the BCH price analysis provides a mixed outlook. The Relative Strength Index (RSI) line stayed above the midline region and witnessed a slightly bullish outlook.
Also, the Chaikin Money Flow (CMF) reading was around 0.05. It pointed toward liquidity entering the market.
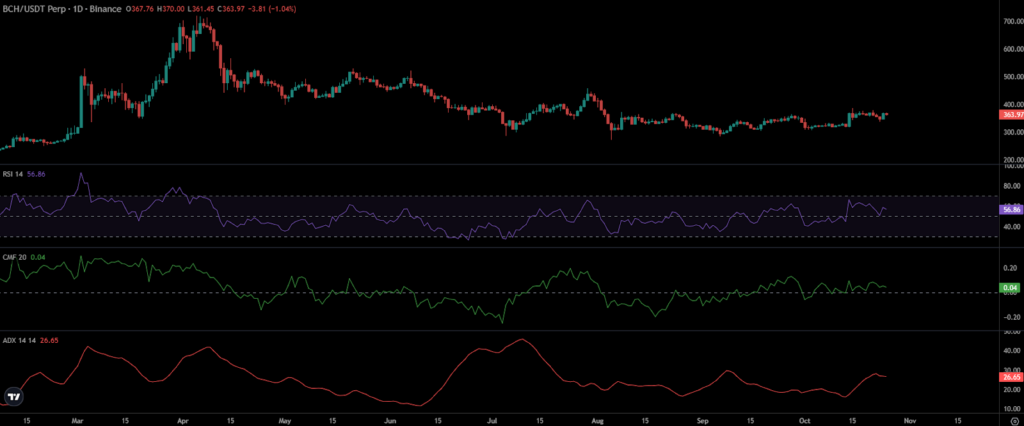
However, the Average Directional Index (ADX) was flat at around 26. That implied uncertainty and confirmation were still due.
The BCH price has stayed above the 38.2% zone per the Fibonacci retracement levels. It faced rejection from the 50% zone, around $380.
Meanwhile, the Open Interest (OI) has risen over 9.90% to $211.30 Million. This implied a fresh long buildup activity over the past 24 hours.
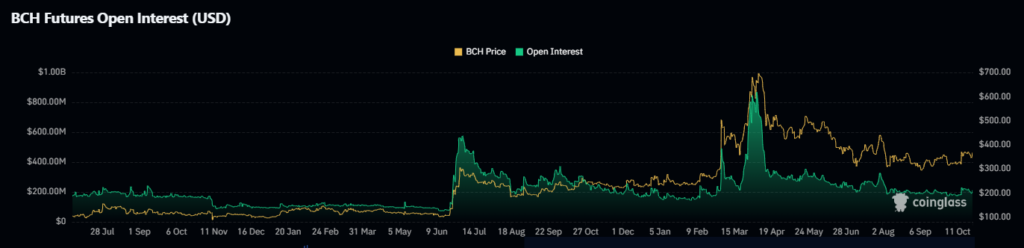
Additionally, the OI-weighted funding rate turned positive to 0.0051%. That reflected the demand for long positions among the market participants.
The immediate support zones for BCH crypto were $355 and $348. On the other hand, the upside hurdles were $380 and $400 to watch out for the coming sessions.
Disclaimer
In this article, the views, and opinions stated by the author, or any people named are for informational purposes only, and they don’t establish the investment, financial, or any other advice. Trading or investing in cryptocurrency assets comes with a risk of financial loss.