streamoors
 Celestia
 Injective
 Pudgy Penguins
 Pearl
Pearl NEAR Protocol
 Quantus
- The Ethereum price consolidated around $2500, underlying a bearish sentiment.
- Analysts highlighted a TD sequential buy signal, suggesting a bounce ahead.
Ethereum (ETH) price has been in a sideways consolidation phase for the past few weeks. The ETH price tumbled below the 50-day EMA mark and witnessed selling pressure this week. ETH bulls struggled to establish a decisive trend after breaking below the $3000 mark.
The ETH price recently flipped from the $2800 resistance. This led to a decline below its 20-day EMA mark, prevailing a bearish sentiment.
The token has corrected over 13% in the past seven days and witnessed bearishness. It has continued to drop within a falling channel. That made lower highs and lower lows on the daily chart.
TD (Tom Demark) Sequential Signals Bounce For Ethereum
In a recent post on X, Ali highlighted that ETH might be in for a reversal and could rebound to $2665. Based on the technical indicator TD (Tom Demark) sequential, it revealed a buy signal for ETH. He added that if the $2412 support level holds, the Ethereum price may see a bounce shortly.
Typically, TD sequential is a popular technical analysis tool traders use to identify trend reversals. In the case of ETH, Ali’s observation of the TD sequential flashing a buy signal suggested a potential bounce imminent. This bounce could be over 7-8%.
Analysts Views On Ethereum: What to Expect Ahead?
In his recent tweet, Louis Yellow said that the Ethereum price was edging closer to a symmetrical triangle pattern. A 23% surge in the case of a successful breakout was imminent.
Additionally, Ethereum exchanges saw $80M in withdrawals. This may alleviate some of the selling pressure.
Also, Kingscharts highlighted in his tweet that ETH formed an ascending triangle pattern. It reclaimed above the $2800 mark would lead to ATH levels soon.
Ethereum Price Analysis: A Look at Chart Patterns
Ethereum price analysis on daily charts revealed mixed cues. That signaled indecision among the bulls and bears. However, the bear cartel had a slight edge as the ETH price dropped below the key EMAs. It displayed weakness on the chart.
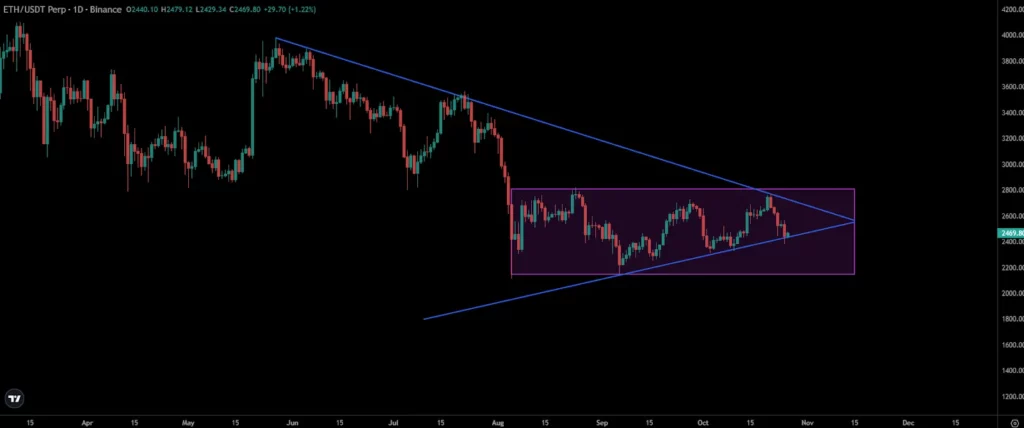
Although the ETH price has been stuck in a narrow range for the past three weeks. A symmetrical triangle pattern has also emerged, signaling a potential reversal ahead.
Ethereum price was trading at $2466 at press time, noting an intraday decline of over 1.09%. Currently, it rests close to the ascending trendline support zone and anticipates a bounce toward the $2600 level.
Amid the choppy movements, the futures market data reveals bullish cues. The OI-weighted data represented a sustained demand for the long positions. The funding rate was 0.0116% at press time.
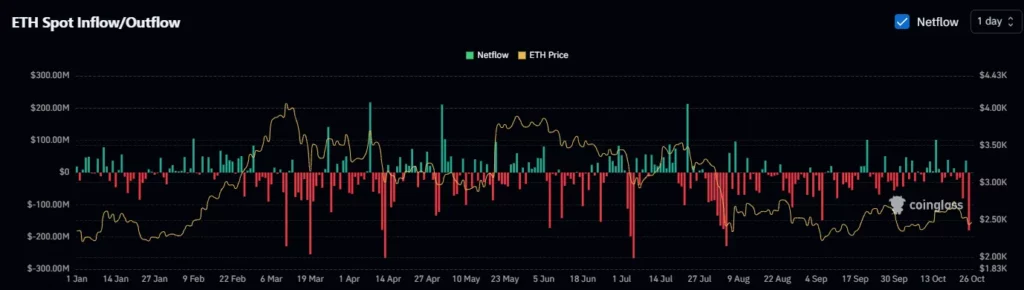
However, the spot netflow data represents bearish data, as an outflow of $179.28 Million was noted in the intraday session. This directed a negative sentiment among the market participants.
The immediate support zones for ETH were $2400 and $2320. On the other hand, the upside hurdles were $2580 and $2650.
Disclaimer
In this article, the views, and opinions stated by the author, or any people named are for informational purposes only, and they don’t establish the investment, financial, or any other advice. Trading or investing in cryptocurrency assets comes with a risk of financial loss.