
 streamoors
 IGNITION
 Quantus
 Sui
Sui Zcash
Zcash Ethereum
 Pearl
Pearl
- PEPE crypto was positioned for a 3rd Elliott wave, indicating a potential surge ahead.
- It has climbed above the 78.6% Fib level, replicating bullish activity.
Following the U.S. Presidential Election and Donald Trump’s victory, the broader cryptocurrency market has registered a massive rally. Amidst this, the memecoin space, including the PEPE crypto, has skyrocketed to the moon and witnessed significant bullish momentum.
Backed by strong community developments and integration into various DeFi platforms, the PEPE coin price has kept outperforming. The token has surged over 60% in a week.
It has crossed the 78.6% Fibonacci level and was poised for a massive upsurge. A close above the $0.00001500 level would trigger further short covering that may send PEPE crypto toward $0.00002000.
PEPE Coin Price At Press Time
The PEPE coin price was trading at $0.00001300. It has noted an intraday decline of over 9.20%. During the intraday session, a minor profit booking was reflected.
With a market cap of $5.47 Billion, PEPE crypto ranked 22nd among the top crypto coins. It has a volume-to-market cap ratio of 0.663 and a total supply of 420.69 Trillion.
Analyst Suggests Potential Surge Ahead
In a recent tweet, a crypto analyst, Man of Bitcoin, stated that the PEPE coin has breached the 78.6% Fibonacci retracement level.
He projected a chart, replicating that the PEPE crypto was poised to reach the highest territory of the 3rd Eliott wave. That indicated a potential upsurge in the coming sessions.
However, a break above the $0.0000172 mark would confirm this scenario. Wave 3 in Elliott Wave theory is typically one of the strongest waves in a five-wave sequence. That, If the PEPE ****can hold or build on current levels, there is potential for further upside.
Thus, in the case of wave 3’s continuation, the Fibonacci extension levels aim for $0.000015685 and $0.000018533. Also, the long-term level is $0.000024280.
PEPE Price Prediction: Will the Bull Run Persist?
PEPE price prediction conveyed a bullish stance, as it has reached the upper Bollinger band. The Relative Strength Index (RSI) line rested in the overbought zone, around 66 at press time. There is a positive divergence in the chart.
Moreover, the Moving Average Convergence Divergence (MACD) indicator plotted the green histogram reading. This conveyed the growing bullish momentum.
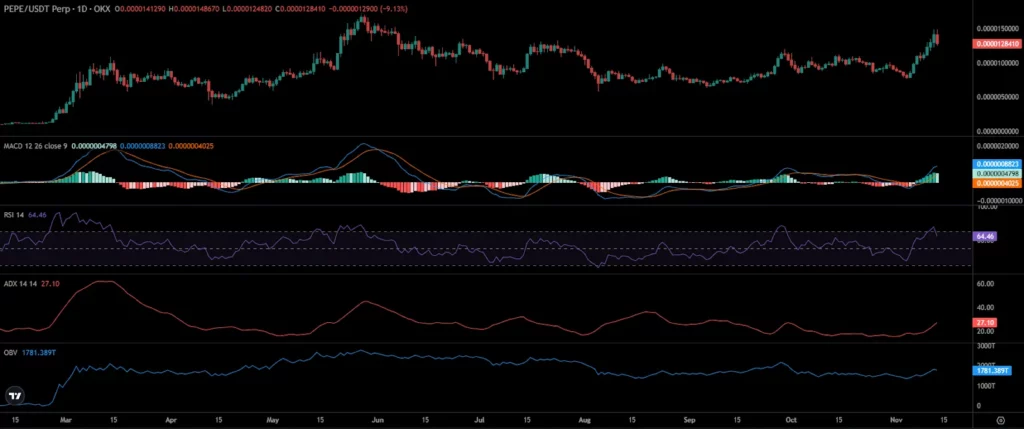
Meanwhile, the On-Balance-Volume (OBV) curve remained close to the midline region. This does not give a strong bullish conviction. Typically, an increase in OBV means substantial accumulation. The OBV was depicting neutral observations, conveying a need for more clarity.
The price action revealed that buyers remained present and added long positions. On the other hand, sellers looked in trouble.
Futures Market Data Represent Bullish Readings
Data from Coinglass revealed that the demand for long contracts was at its peak. The consistent positive OI-weighted funding rates evidenced this. The OI-weighted funding rate at press time was 0.0331%, representing the bullish readings.
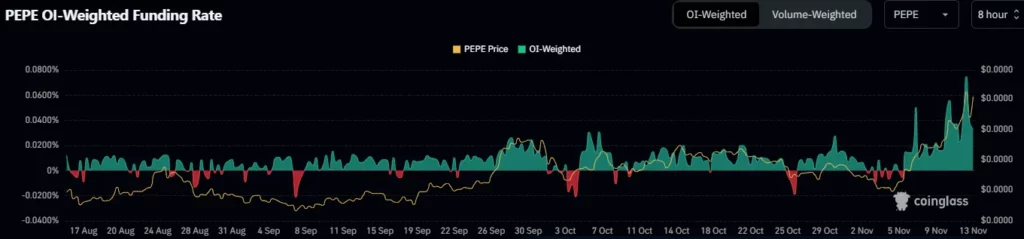
However, the Open Interest (OI) has dropped over 12.20% to $183.20 Million. This represented a long, unwinding move in the past 24 hours.
The immediate support zones for the PEPE coin price were $0.00001200 and $0.00001160. At the same time, the upside hurdles were $0.00001430 and $0.00001720.
Disclaimer
In this article, the views, and opinions stated by the author, or any people named are for informational purposes only, and they don’t establish the investment, financial, or any other advice. Trading or investing in cryptocurrency assets comes with a risk of financial loss.




