
 streamoors
 IGNITION
 no crying in the casino
 Sword Inu
 Altai the Tiger
 NEAR Protocol
 Quantus
- Solana price is showing signs of a bullish breakout, with a “cup and handle” chart pattern hinting at a potential surge toward the $400-$500 range.
- Meanwhile, meme coins on the Solana blockchain are generating significant activity, surpassing $1 Billion in daily trading volume.
- Additionally, strong capital inflows into the network are evident, as the Chaikin Money Flow (CMF) indicator remains firmly in positive territory, currently sitting at 0.22.
Solana (SOL), currently the fourth-largest cryptocurrency by market capitalization, is on track to reclaim its all-time high.
Like many altcoins, Solana price has broken through a key resistance level, posting an impressive 56% price increase this month.
Notably, his week, SOL built momentum after flipping the $200 level from resistance to support. Intraday trading sessions played a major role, delivering over 20% gains and attracting significant buyer interest.
Currently, SOL is trading at around $245. However, its trading volume has dipped by over 7% in the last 24 hours following substantial intraday gains.
The upward price movement reflects increased trader engagement, with analysts providing further optimism about SOL’s future potential.
Continue reading to know more about Solana’s price.
Monthly Solana Price Action Shows $500 Is The Next Big Target
Solana (SOL) is gaining attention among traders as its price chart reveals a “Cup and Handle” pattern, signaling a potential bullish breakout.
This technical formation began to take shape following the sharp correction during the late 2021 market crash, when SOL’s price plummeted below $10, hitting a low of $8 during the subsequent bear market.
Since early 2023, Solana price has been on a recovery trajectory, climbing steadily to its current levels. Analysts predict this pattern could propel SOL’s price to the $400-$500 range.
The depth of the “cup” often serves as a measure for the potential upward move following a breakout.
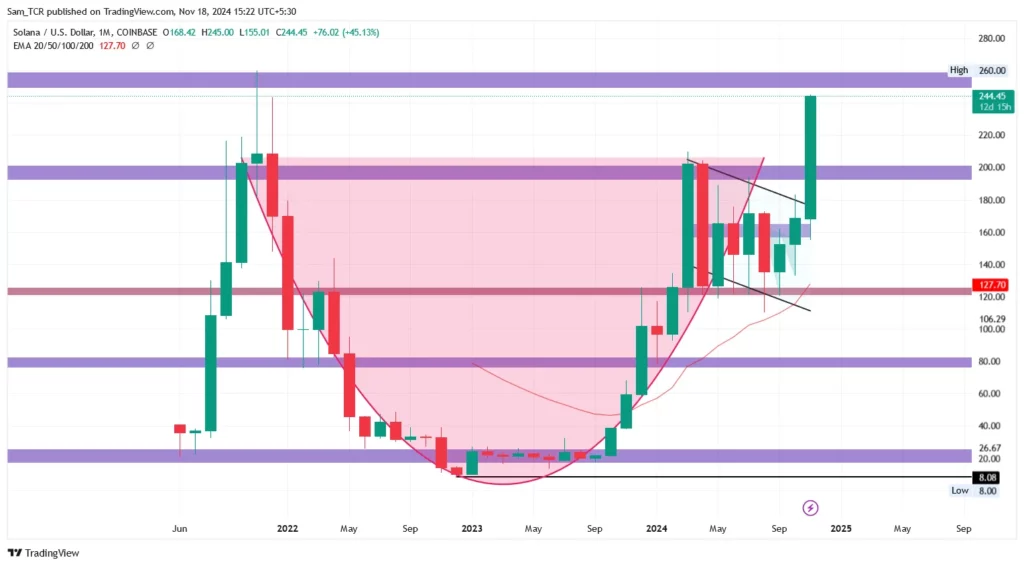
Historically, the “Cup and Handle” pattern has been a reliable indicator of bullish trends in long-term charts.
Combined with growing interest from buyers and sustained market momentum, experts suggest SOL could eventually achieve these ambitious targets in the future.
Solana price, Short-Term and Long-Term Outlooks
Short-term indicators for Solana (SOL) suggest a more modest trajectory. Analysts examining the hourly chart have identified a bullish channel leading to the $260 mark. This aligns with a pennant breakout observed over shorter timeframes.
One analyst highlighted Solana’s strong weekly performance, calling it “extremely bullish.” He also noted the remarkable activity surrounding meme coins on the Solana network, which are generating over $1 Billion in daily trading volume. This is solidifying Solana as his top crypto pick for this market cycle.
On a broader scale, long-term projections remain optimistic, with analysts predicting Solana price could revisit its all-time high and potentially surge to the $400-$500 range.
$SOL looking super bullish on the weekly! Let’s send it to ATH!
— Bitcoin Buddha (@Bitcoin_Buddah) November 14, 2024
When $SOL memes are hitting 1B+ volume/24h, it’s time to $SOL
SOLANA will remain my top pick this cycle https://t.co/9AglKTo6tr pic.twitter.com/fgcpFn7osf
Given its rising popularity and strong market performance, Solana is a key asset for those closely following the crypto space.
With a current market cap of $115.81 Billion, Solana crypto remains one of the most prominent digital assets.
Over the last 24 hours, its market cap has increased by 3%, while trading volume stands at $7.92 Billion, a slight 7% dip, likely reflecting short-term consolidation following recent gains.
SOL is Picking up the Pace
Solana’s price has recovered bullishly, bouncing decisively off its 20-day, 50-day, and 200-day EMA levels. The crypto is steadily climbing, nearing the $250 mark.
Despite some periods of slower momentum earlier this week, intraday trading sessions reignited a sharp upward move.
The MACD histogram confirmed this rising momentum, registering a value of 3.69, while the Awesome Oscillator (AO) reached 39.41, further highlighting the surge in buying activity.
Additionally, capital inflows remain robust, as evidenced by the Chaikin Money Flow (CMF), which holds above the zero line at 0.22.
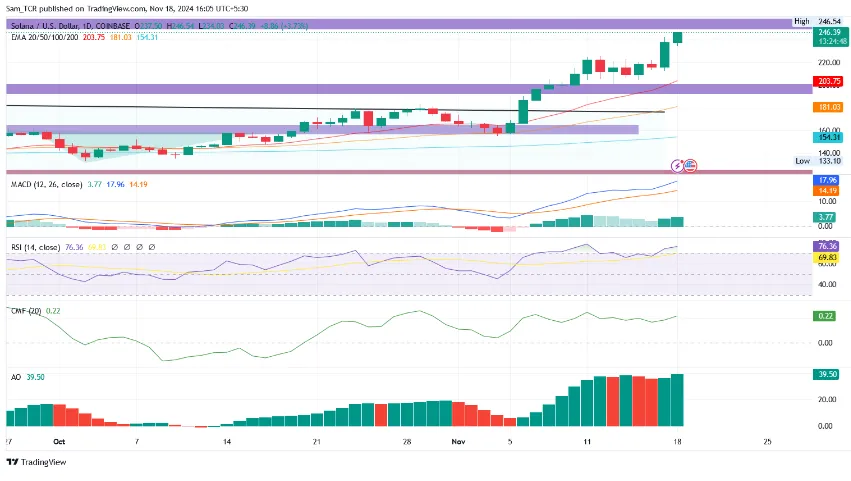
However, the Relative Strength Index (RSI) has climbed to 76.11, signaling overbought conditions. A pullback or sideways price movement won’t be surprising in the near term.
Disclaimer
In this article, the views, and opinions stated by the author, or any people named are for informational purposes only, and they don’t establish the investment, financial, or any other advice. Trading or investing in cryptocurrency assets comes with a risk of financial loss.




