
 Dacity Coin
 NEAR Protocol
 Pearl
Pearl Pudgy Penguins
 Injective
 Aerodrome Finance
 Pump.fun
- MAGA price has surged by 35% in a week and halted near 20-day EMA.
- Trading volume has increased by 43%, indicating new players’ engagement.
TRUMP’s (MAGA) price have been on a strong bearish trend, like a blood bath. It has dropped by 90% since June and has reached a multi-year low. Since June, the MAGA price has declined by forming lower lows and lower highs.
According to the technical chart, the bearish trend seems to stop near the $1.30 level. RSI has displayed a bullish divergence, which has resulted in a mild elevation. The MAGA coin price has risen by 35% in a week and reached the 20-day EMA.
Could the MAGA Price Recover From the Bottom or Keep Surging?
When writing, TRUMP memecoin was trading at $1.68. It has dropped by 5.56% over the past 24 hours. The market capitalization was $74.58 Million, and the 24-hour trading volume was $3.24 Million.
The MAGA price action has displayed a short-term accumulation phase at the bottom. Here, mild buying pressure has been received. However, despite an RSI bullish divergence, the bullish trend has failed.
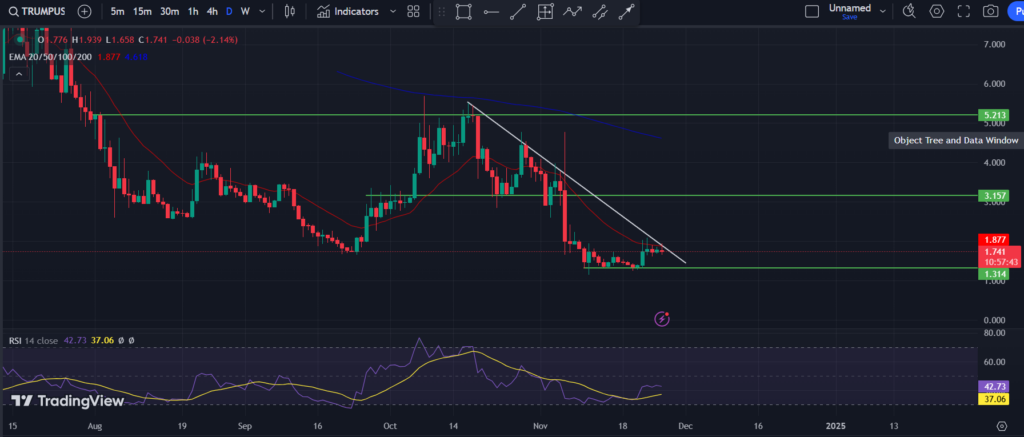
The TRUMP price has been struggling below the 20-day EMA for the past few days. If the price surpasses the 20-day EMA, it would be a bullish sign.
A loss recovery trend can be observed once the price starts trading over this moving average. If the trading volume supports this momentum, buyers may be eyeing the 200-day EMA.
On the other hand, if the digital asset price fails to exceed the 20-day EMA, sellers may dominate ahead. Any bearish candlestick near the 20-day EMA could attract bears. Strong bearish momentum can be seen once the price loses the last swing low,
By seeing technical indicators, RSI has witnessed a bullish divergence, which showcases the bullish forecast. The MACD has triggered a golden crossover with the Signal line. The histograms have flipped to green, indicating a bullish forecast.
Technical Analysis of MAGA Coin Over 4-H Timeframe
The technical chart suggested that the MAGA price has struggled in a parallel channel in a 4-H time frame. However, the price stayed near the upper trendline and held the 20-day EMA.
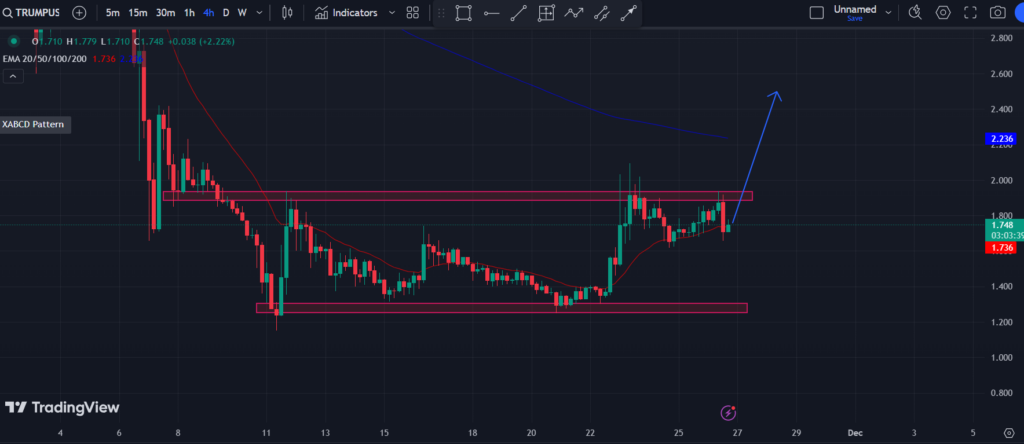
Buyers may show interest if the MAGA coin price triggers a breakout from the parallel channel. If the price surpasses the 200-day EMA, investors might be confident and ride the trend further.
Conversely, if the price fails to trigger a breakout, sellers may drag down the price to a lower level. Once the price starts trading below this channel, buyers might find it difficult to bounce back.
MAGA Price Analysis and Forecast
The MAGA price has shown signs of potential recovery following a significant decline. That was evidenced by a 35% surge and a bullish divergence in the RSI.
Although trading volume has increased, indicating growing interest from new participants, the price remains under pressure. It has struggled to break above the crucial 20-day EMA.
It could signal a more substantial bullish trend if it successfully surpasses this hurdle. Also, a possible recovery toward higher moving averages was seen.
However, maintaining this momentum may lead to renewed selling pressure. Traders must closely monitor price action and volume dynamics in the coming days.
The technical indicators underscored the need for vigilance in navigating this volatile market. At the same time, they presented a cautiously optimistic outlook,
Disclaimer
In this article, the views, and opinions stated by the author, or any people named are for informational purposes only, and they don’t establish the investment, financial, or any other advice. Trading or investing in cryptocurrency assets comes with a risk of financial loss.




