
 streamoors
 Altai the Tiger
 Sword Inu
 IGNITION
 no crying in the casino
 Quantus
 NEAR Protocol
- The global M2 trend is down, indicating a bearish move in Bitcoin.
- Bitcoin price has witnessed a 6% fall from its all-time high (ATH).
Bitcoin (BTC) will likely see a 20–25% correction shortly. That’s possible, given its strong relationship with the global M2 money supply and the recent decline in M2.
Amid this bull run, the BTC price has displayed a 6% pullback from its ATH and dropped to the 20-day EMA. However, a mild buying pressure was seen, and it’s likely to defend the 20-day EMA.
Based on the technical chart, the Bitcoin price has displayed a massive bullish trend and reached ATH. The technical analysis suggested buyers must defend the $89K level to remain bullish. The recent fall in price could lead to a pullback, and another ATH can be seen.
Technical Analysis of Bitcoin Price Over 1-D Timeframe
When writing, the Bitcoin crypto was trading at $93,511.00. That has increased by 1.71% over the past 24 hours. The market capitalization was $1.85 Trillion, and the 24-hour trading volume was $81.14 Billion.
A bullish engulfing was seen in the pullback zone, which could initiate a bullish trend. The price has defended the previous accumulation zone, which shows the bulls’ domination.
Suppose the BTC price holds over the 20-day EMA for over a week; buyers might be confident. Once the price manages to exceed the last swing high, buyers may dominate further. Moving ahead, another bull run can be anticipated.
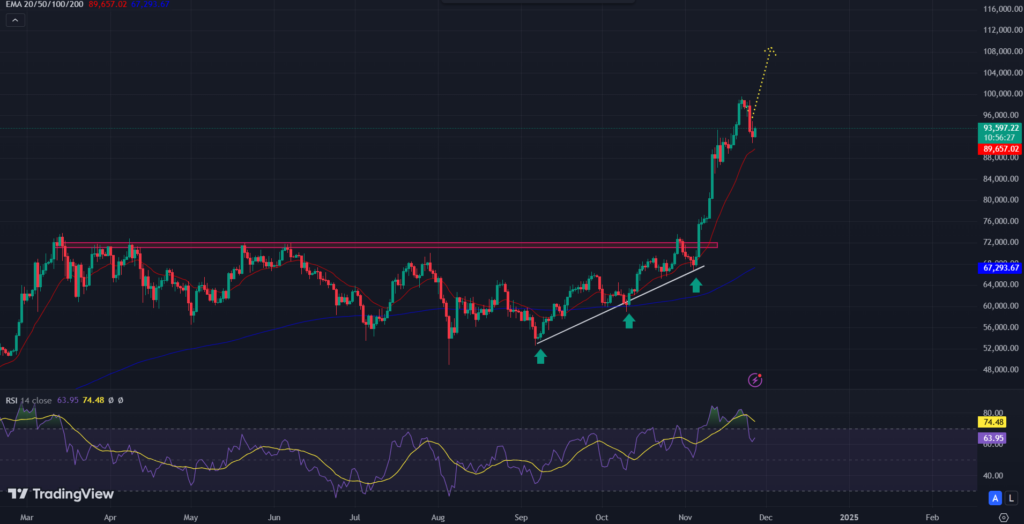
On the other hand, if the crypto asset price slips below the 20-day EMA, it could be a bearish signal. Suppose the price is sustained below the precious accumulation zone, and a selling opportunity can be seen.
Another support level could be the $85K, and losing this level could result in a massive profit booking. Turning to the technical indicators, the MACD has triggered a death crossover with the Signal line.
The histograms have flipped to red, which signals a bearish forecast. The RSI has witnessed a bearish crossover, with the RSI-based moving average indicating the bears’ comeback.
Bitcoin Realized Profit/Loss Ratio and Market Overheating
The market may be overheating, as indicated by the Bitcoin Realized Profit/Loss P/L ratio, which is at all-time highs. This indicator helps us understand the market’s mood and shows how much Bitcoin price was gained or lost.
A spike in the realized P/L ratio typically indicated abnormally high investor-side realized P/L levels. That corresponded to many investors taking profits following a significant price increase, frequently at market peaks.
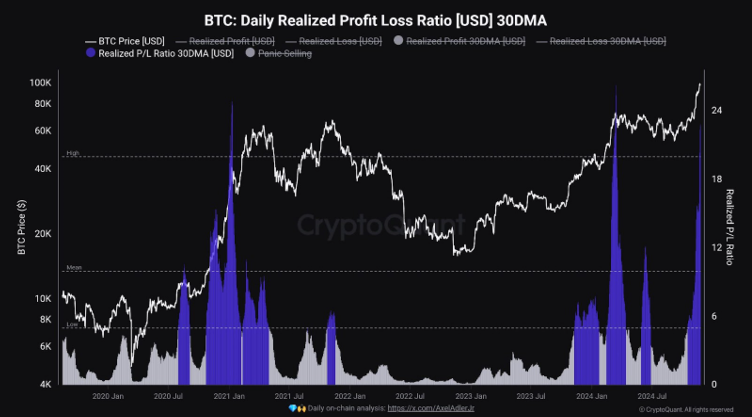
The P/L ratio’s current high values indicate that most investors are cashing out. It is a sign that the market’s current bullish momentum is ending.
Such behavior frequently indicates a market top, and demand cooling may portend a price correction. Similar increases in the P/L ratio have historically preceded Bitcoin price increases. Moreover, the P/L ratio has also experienced a sharp price decline.
Bitcoin Price Today and Its Forecast
The BTC price was currently at a crucial juncture. It has faced both potential upside and downside risks. The recent decline in the global M2 money supply suggested a bearish outlook. That indicated a possible 20-25% correction from its current price.
While there has been mild buying pressure defending the 20-day EMA, maintaining this level is essential for a bullish continuation. The technical analysis showed a strong bullish trend. However, if the price slips below the 20-day EMA or the $85K support level, it could trigger selling opportunities.
Additionally, bearish signals from technical indicators like the MACD and RSI indicated that caution is warranted for traders. Overall, opportunities for gains exist. However, the prevailing technical factors suggest traders should be vigilant and prepared for volatility in the coming weeks.
Disclaimer
In this article, the views, and opinions stated by the author, or any people named are for informational purposes only, and they don’t establish the investment, financial, or any other advice. Trading or investing in cryptocurrency assets comes with a risk of financial loss.




