
 streamoors
 IGNITION
 Injective
 Pearl
Pearl NEAR Protocol
 Quantus
 Aerodrome Finance
- The BONK price has retested the 20-day EMA mark after correcting from the ATH mark of $0.5916.
- Weighted sentiment data was reflecting a bullish outlook.
Bonk’s (BONK) price has stayed calm in the last 24 hours. The token could be looking for sideways movement instead of further drawdown. After hitting an all-time high, significant profit booking resulted in a correction of over 23%.
Amidst the bullish sentiment, the BONK coin retested and bounced off from the 20-day EMA mark and signaled reversal cues. However, the market structure was still favoring the uptrend. That’s because the BONK price persisted in forming higher highs and rested above the key EMAs.
The bullish impulse remained intact despite the initial price drop of over 20%. Moreover, the BONK crypto could see a bounce toward the ATH in the coming days.
The Fibonacci retracement levels underlined $0.00004100 as the critical short-term support zone. At the same time, $0.00005100 was a vital resistance level.
5th Bullish Wave In Play: Analyst Weigh In
Crypto Analyst Freedom By 40 highlighted in his post that the BONK coin has completed the 4th retracement phase. Furthermore, it was poised to fill the 5th rising wave.
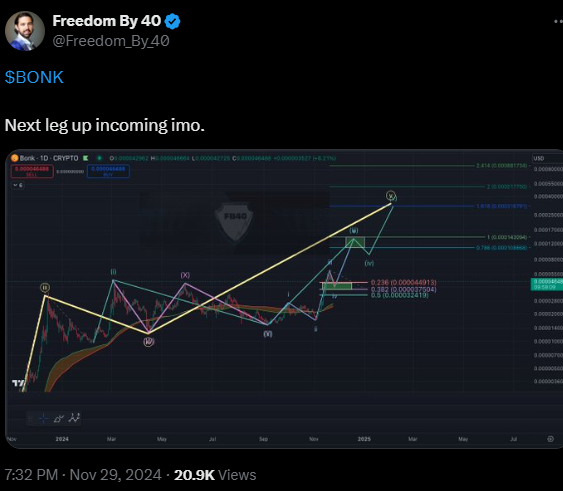
In case of a successful breakthrough above the ATH, it could rise toward $0.00012000 in the coming days. Similarly, Kings Charts said BONK crypto has retested the 61.8% Fib level and could see a reversal ahead.
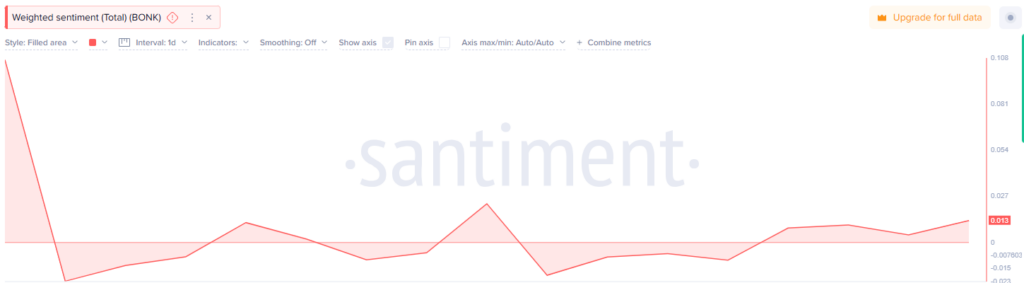
Despite the significant price retracement, the weighted sentiment data remained firmly bullish. It reflected a positive outlook. The weighted sentiment curve sails above the zero line at press time, depicting bullish readings.
BONK Price Prediction Showing Bullishness on Higher Timeframes
BONK price prediction has been bullish in the long term. However, some volatility could be seen in the short term. The upward trend persisted even after a retreat from the ATH. In the upcoming sessions, there may also be a follow-on purchasing activity.
BONK’s impressive price action has rebounded from the 20-day EMA mark. It has been trending higher since the beginning of this month. Amidst flat movement in the last 24 hours, signs of accumulation were noted as OBV rises.
The Relative Strength Index (RSI) had a reading of 58, indicating bullish momentum. On the other hand, it also suggested that there is enough room for further upside.
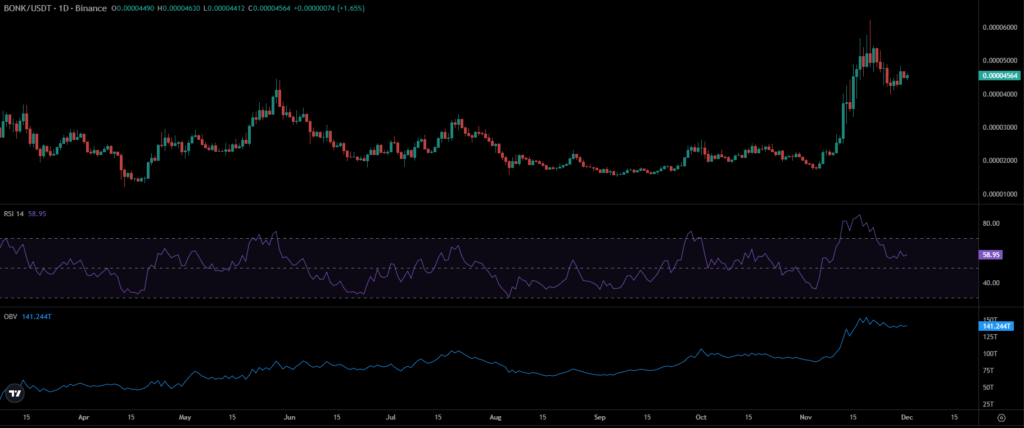
A deeper retracement below $0.00004000 would flip the trend and may see bearish swings. However, the daily and weekly time frame price action remained bullish.
The OBV tried to climb above the five-week high but has rebuffed. This indicated a lack of consistent buying pressure. Therefore, while the retest was done, the uptrend appeared intact. Moreover, the token may see a relief bounce soon.
Long Liquidations Dominate the BONK market
Open Interest declined in the past three days as the meme token lost its lower timeframe bullish momentum. While the BONK coin’s OI has declined, the liquidation data replicated a different view. On 30th November, long liquidation amounted to $59.8k compared to $8k for shorts.
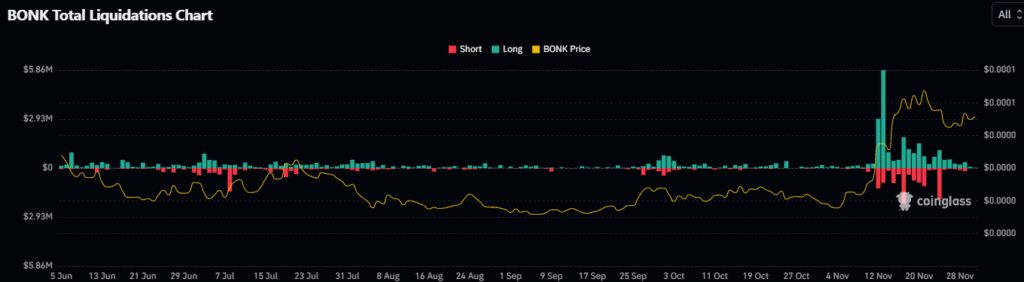
The disparity widened on 1st December, with $79.8k in long liquidations versus $8.90k for shorts. This pattern suggested that traders are betting on an upward momentum. Furthermore, the BONK price could see a significant upside ahead.
The immediate support zones were $0.00004300 and $0.00004170. At the same time, the resistance levels were $0.00004800 and $0.00005000.
Disclaimer
In this article, the views, and opinions stated by the author, or any people named are for informational purposes only, and they don’t establish the investment, financial, or any other advice. Trading or investing in cryptocurrency assets comes with a risk of financial loss.




