
 streamoors
 IGNITION
 Sword Inu
 no crying in the casino
 Altai the Tiger
 Pearl
Pearl Pudgy Penguins
- Stellar price faced a pullback this week, trading around $0.517 on Wednesday.
- Market indicators and On-chain data favor the bullish outlook.
Stellar (XLM) price experienced a massive rally of over 450 in the last 30 days as the crypto bull run accelerated. However, the XLM crypto now appears tiring as its upward trajectory toward $1 seemed to stall.
Meanwhile, most crypto analysts were optimistic that XLM crypto has the potential to rally. The reason behind the speculation was that the price action looked bullish.
When writing, the XLM price traded at $0.5170, a decline of over 3.26%. It experienced modest selling pressure over the past 24 hours.
XLM Crypto Volume and TVL Surges
Data from Artemis revealed that XLM’s DEX trading volume has registered a sharp spike over the last seven days. The rise in DEX trading volume, particularly driven by XLM, highlighted the increasing demand for decentralized finance (DeFi) services.
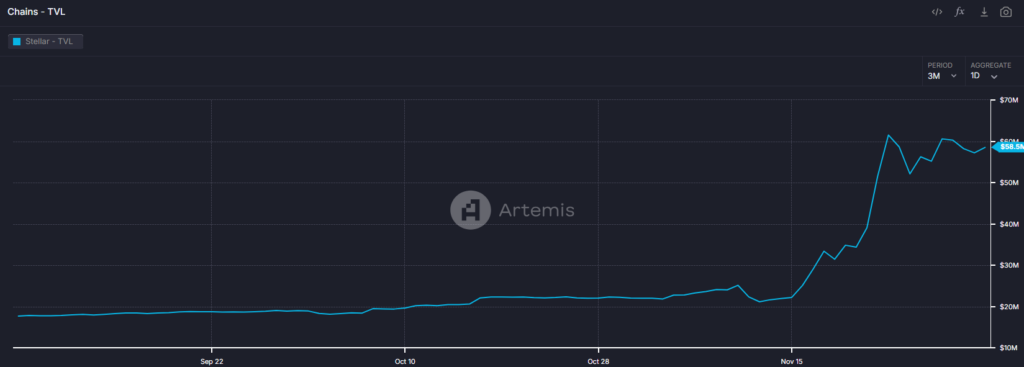
In tandem with the rise in DEX trading volume, the Stellar price has also seen a notable uptick in its Total Value Locked (TVL). Last week, the TVL of the platform peaked at $61.51 Million. That marked the highest level since its decline around October 2022.
As of the latest data, the TVL has slightly adjusted to around $57.46 Million. This sustained high level of TVL and trading volume underscored high engagement and liquidity within the ecosystem.
XLM Crypto on the Path to $1: Analysts Weigh In
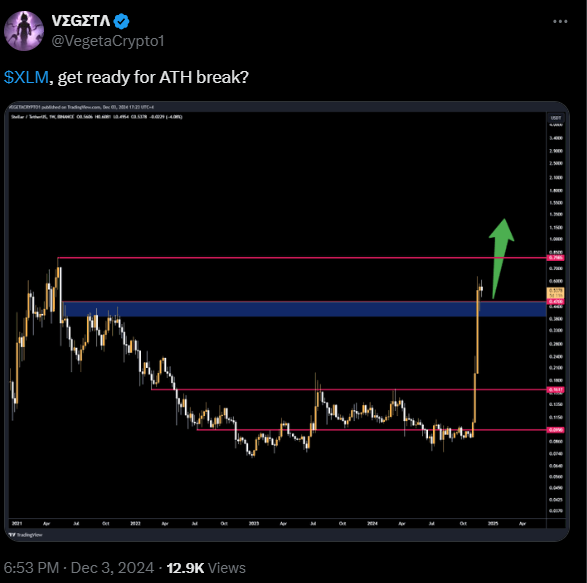
A tweet by @Vegetacrypto 1 highlighted that the XLM price is ready to breach its ATH trajectory. Furthermore, the token could reach the $1 mark in the coming days.
Likewise, Armando Pantoja mentioned that XLM is trading on a strong bullish momentum. It has bounced off from the EMA ribbon support zone after retesting the $0.4500 support zone. The uptrend remained intact, and the altcoin could pass the $1 mark shortly.
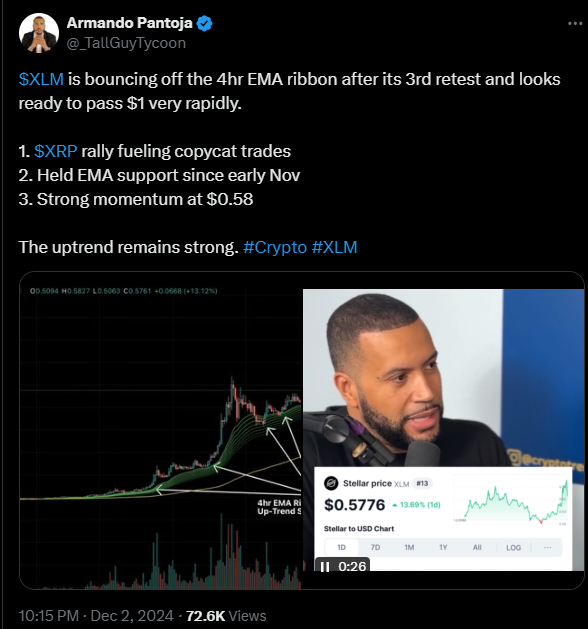
Per the Fib retracement levels, the XLM price has traded close to the 78.6% level. Moving ahead, it sustained momentum beyond the key EMA lines. The bollinger band was squeezing on the 4-hour timeframe, meaning a giant upmove was on the horizon.
XLM Price Prediction: Decoding the Chart
XLM crypto has experienced significant gains over the past week. This increase in its value, with a substantial surge in volume, highlighted intensified interest among traders. They are looking to capitalize on XLM’s upward trend.
The technical indicators add further weight to the bullish case. XLM’s Relative Strength Index (RSI) rose to 68, signaling that XLM is approaching overbought territory.
Moreover, the Moving Average Convergence Divergence (MACD) indicator plotted green histogram readings. That justified the bullish case.
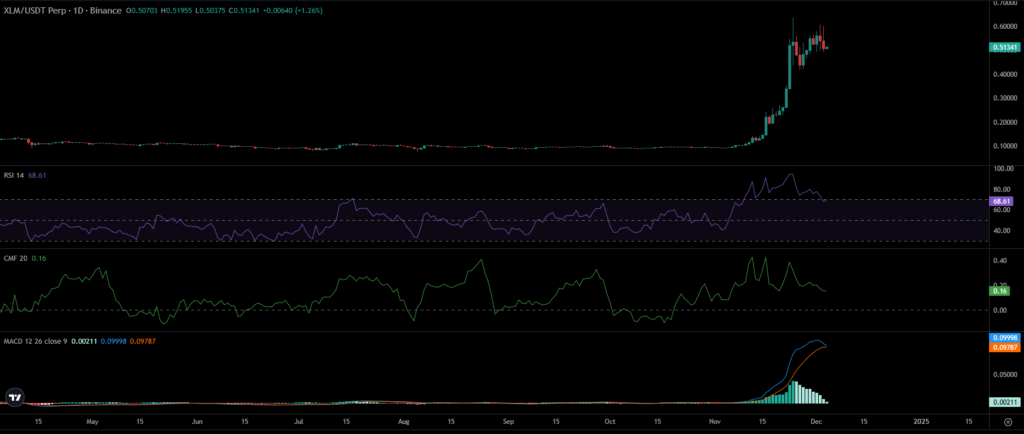
The Chaikin Money Flow (CMF) indicator reading of 0.16 signaled a surge in inflows into the market. Traders should keep an eye on the $0.5500 level. Crossing this juncture would trigger a follow-on rise toward the $0.6000 mark.
However, XLM’s Open Interest has dropped by 4.76%, reaching $348.30 Million. This represents a long, unwinding move over the past 24 hours.
The immediate support zones were $0.5100 and $0.5050. At the same time, the resistance zones were $0.5320 and $0.5500.
Disclaimer
In this article, the views, and opinions stated by the author, or any people named are for informational purposes only, and they don’t establish the investment, financial, or any other advice. Trading or investing in cryptocurrency assets comes with a risk of financial loss.




