
 streamoors
 IGNITION
 Sword Inu
 no crying in the casino
 Altai the Tiger
 Pearl
Pearl Pudgy Penguins
- Bitcoin’s market value has reached $2 Trillion.
- The BTC price witnessed an 8% increase in less than 2 days.
Bitcoin’s (BTC) price has displayed an outstanding bullish move. That mounted by 8% in less than two days. Amid this bull run, the Bitcoin price has smashed the milestone of $100K and traveled to the $104K mark. However, a mild selling pressure of 1.75% was received.
During the daily time frame, the BTC price triggered a breakout from a two-week accumulation phase. This breakout was in the form of a pullback by defending the 20-day EMA.
Bitcoin Price Surpassed $100K Mark: Could BTC Price Extend to $110 Level?
When writing, the Bitcoin price was trading at $101,416.00, with an intraday gain of 5.06%. Its market capitalization has climbed to $2 Trillion from $1.90 Trillion in the past few hours. The 24-hour trading volume has increased by 71.64% to $118.43 Billion.
Looking at the chart, the BTC price has been receiving buying pressure since September. Moreover, it blasted in November and resulted in a giant bullish move. Amid this bullish trend, the token’s price has recorded a new all-time high (ATH) of $104K today (Dec 05).
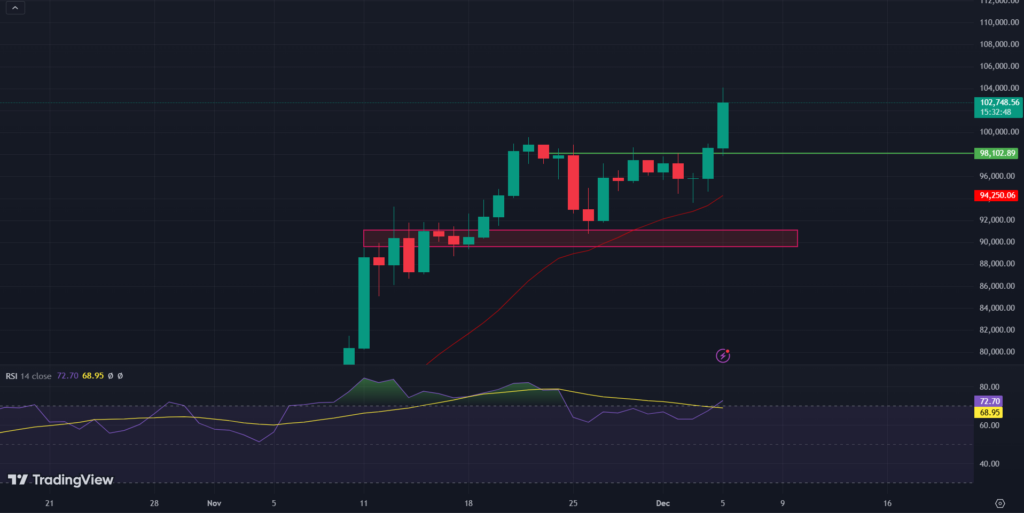
Suppose the price holds over a short-term resistance level of $99K; buyers might drive the trend. The recent pullback can lift the price to the $110K territory.
If the price sustains over the $100K territory, buyers might show interest and BTC may remain bullish for the next few weeks. Alternatively, if the digital asset price loses the $99K mark, most buyers might be liquidated over the $100K mark.
Here, liquidity might bring selling pressure, and a decent fall can be anticipated. The BTC price has been bullish for a long time; therefore, a dip can be seen.
Bitcoin price has been defending the 20-day EMA and has kept rising. RSI has triggered a golden crossover with the RSI-based moving average, heading toward the overbought zone.
Bitcoin Price Analysis Over 4-H Timeframe
The Bitcoin price has formed a triangle pattern in a 4-H time frame, displaying a breakout. After the breakout, the token’s price witnessed a bullish trend. That has resulted in achieving a milestone of $100K.
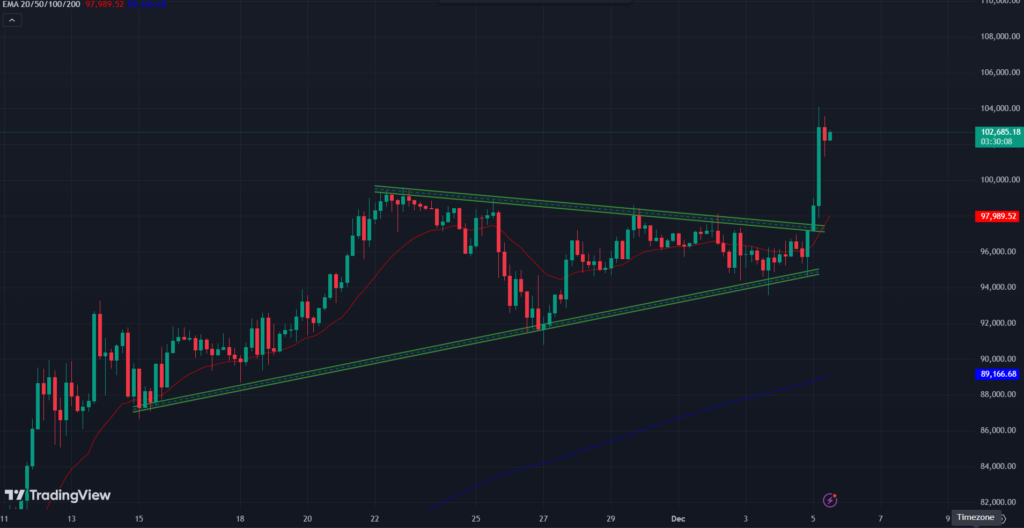
After this bullish move, the crypto is expected to experience a short-term profit booking. In short, a pullback scenario can be generated here. That may lead to another bullish rally.
BTC Price Analysis and Forecast
Bitcoin’s recent surge to the $104K mark represented a significant achievement in its ongoing bullish trend. With this, the market capitalization rose to $2 Trillion. The $99K level of support is crucial for maintaining this momentum.
If Bitcoin can hold above this threshold, there is potential for further upward movement toward the $110K mark. This could attract more buyers in the process.
However, if the Bitcoin price falls below $99K, it may trigger selling pressure, leading to a possible correction. The current market sentiment remained optimistic. It was bolstered by strong buying activity and the recent golden crossover in the RSI.
Overall, the outlook appears bullish in the short term. At the same time, caution is advised as market dynamics can shift swiftly.
Disclaimer
This article is for informational purposes only and provides no financial, investment, or other advice. The author or any people mentioned in this article are not responsible for any financial loss that may occur from investing in or trading. Please do your research before making any financial decisions.




