
 no crying in the casino
 IGNITION
 Hood Sword Inu
 streamoors
 Altai the Tiger
 Sword Inu
 Pearl
Pearl
- Aptos crypto price was showing continuous pushes in the demand zone.
- With $20 as the next target zone, the most recent correction indicated that there is a lot of interest in buying the dip.
- Since the beginning of the year, there has been an increase in the number of daily, weekly, and monthly active addresses on the Aptos blockchain.
Aptos (APT) price has been in a bullish trend since August and surged by 90%. The Aptos crypto price has kept rising by forming lower lows and lower highs. According to the chart structure, the APT crypto price has displayed a dip and melted into the demand zone.
With a distinct target zone indicating a possible upward movement towards $20. The Aptos (APT) price chart offers a compelling story of important support and resistance levels. Several resistance and support levels that have historically impacted the APT price trajectory are highlighted on the chart.
Could We See a Bounce Back from Demand Zone in APT Crypto?
When writing, Aptos crypto was trading at $11.68, and it has remained neutral over the past 24 hours. The market capitalization was $6.26 billion, and the 24-hour trading volume was $599.06 billion.
Based on the chart structure, the price has been struggling in a parallel channel. It surpassed the previous swing of $14 but failed to hold and displayed sharp selling. However, the APT price was staying in the demand zone.
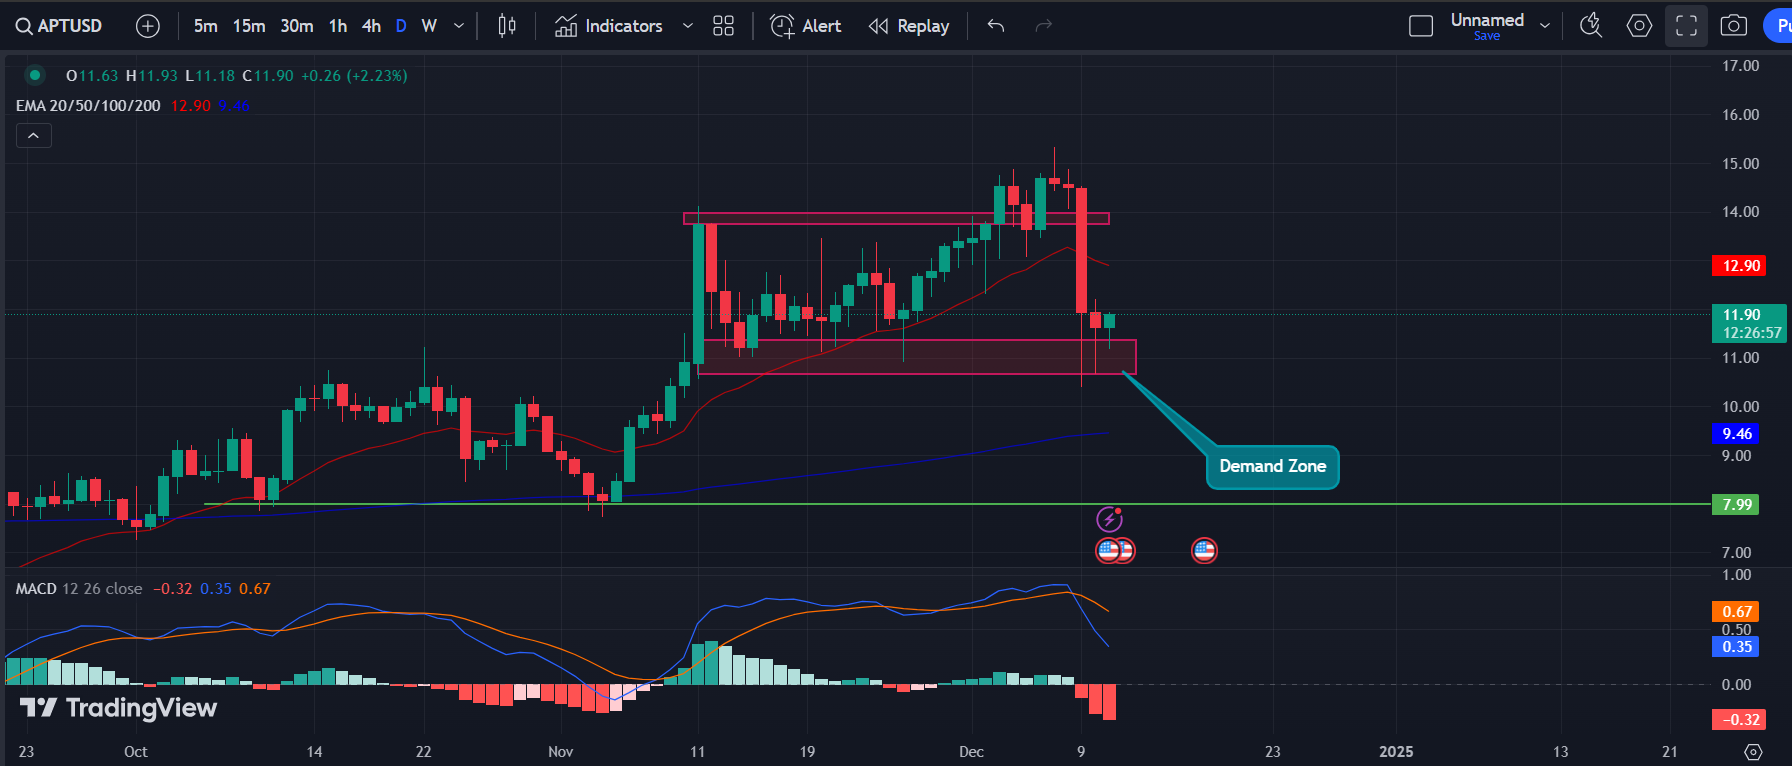
If the APT crypto receives buying pressure in the demand zone, a bullish rally can be anticipated. If buyers survive this dip, strong buying momentum can be experienced. Once the price surpasses the $14 mark, it might keep surging to the $20.
On the other hand, if Aptos crypto price loses the major support level of $11, sellers might show interest. Suppose the price sustains below this level, a bearish trend can be observed.
Turning to the technical indicators, the APT price has slipped below the 20-day EMA and heading toward the 200-day EMA. The RSI has triggered a death crossover with the RSI-based moving average. MACD has displayed a bearish crossover with the Signal line and the histograms have flipped to red. Overall, technical indicators are in favor of bullish forecasts.
A Surge in On-chain Activity Noticed
Pink-highlighted weekly active users have a similar trajectory, but a more noticeable peak around June indicates a time of high activity or perhaps a noteworthy network update or event.
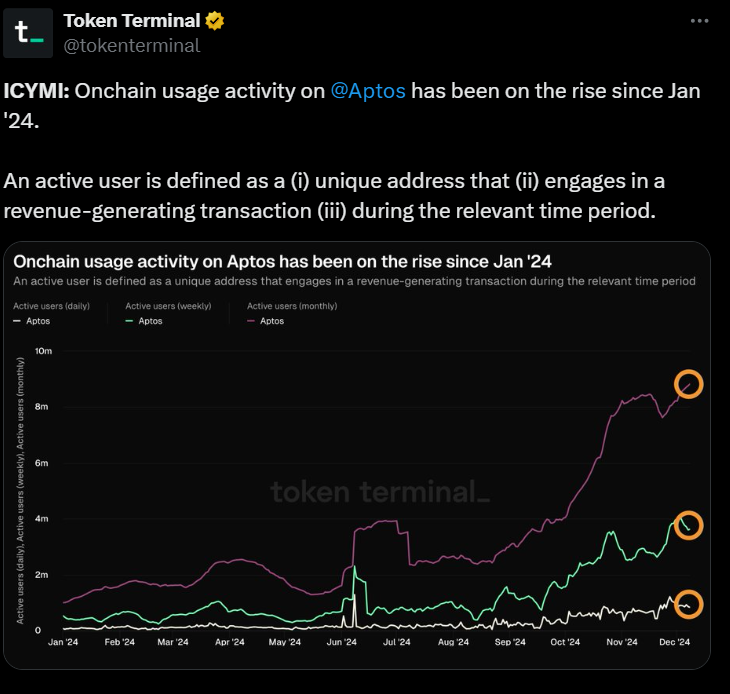
The purple line that represents monthly active users is the most noticeable. It shows a sharp and consistent rise over the year. Particularly starting in August, the number of monthly active users increased dramatically, approaching 10 million by December. This increase highlights a strong and expanding Aptos platform user base.
Aptos Price Analysis and Forecast
Aptos crypto is currently positioned within a demand zone, indicating significant interest from buyers despite recent price corrections. With the price hovering around $11.68 and strong market activity observed in terms of active addresses, there is potential for a bullish rally if buying pressure continues.
The target of $20 remains on the horizon. However, APT must first surpass the critical $14 resistance level. Conversely, if the price drops below the major support level of $11, it could lead to bearish sentiment in the market. Technical indicators suggest a mixed outlook, but the overall trend leans towards cautious optimism, given the demand zone’s presence and rising market interest in Aptos.
Disclaimer
This article is for informational purposes only and provides no financial, investment, or other advice. The author or any people mentioned in this article are not responsible for any financial loss that may occur from investing in or trading. Please do your research before making any financial decisions.




