
 Sword Inu
 streamoors
 Altai the Tiger
 no crying in the casino
 IGNITION
 Pudgy Penguins
 Quantus
- ADA price has declined by 31.72% from this month’s high.
- ADA bears are slowing down. Will the bulls take advantage of this brief pause?
- A bullish pivot is supported by the ADA long/short ratio.
Cardano (ADA) price has been in a bullish trend and has reached a multi-year high. Cardano price surged by 270% in November which has been rising following the 20-day EMA. It has surpassed the psychological level of $1. However, the bullish rally was interrupted near the $1.20 mark.
In the second week of December, ADA price witnessed a dip and slipped below the 20-day EMA. However, buyers have attempted to exceed the 20-day EMA. Moreover, buyers failed to hold for longer and bulls seemed to lose their strength. The price has slipped below the 20-day EMA and heading toward the 200-day EMA.
ADA, Cardano‘s native cryptocurrency, may have a promising start to the week. Now that the selling pressure from last week has diminished, it might even be a bullish one.
Clash Between Bulls and Bears; Who’s Gonna Win
A sizable amount of liquidity is sitting in the same price range, waiting for demand to pick up to support further gains. These liquidity zones also highlight inducement zones, though, where significant liquidation might take place if the price moves in the other direction.
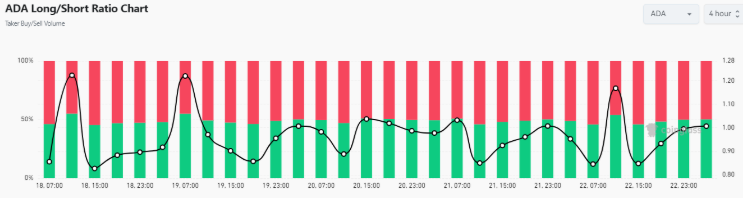
Remarkably, the ratio of ADA longs to shorts verified that there was a change in sentiment. At the time of writing, there were marginally more long positions than short positions during the previous day.
Would ADA Price Regain $1 Mark or Profit Booking Ahead?
Cardano crypto was trading at $0.89 at press time which has climbed by 1.52% over the past 24 hours. The market capitalization was $31.51 Billion and the 24-hour trading volume was $1.19 Billion.
On a daily time frame, the price has shaped an inverted head and shoulder pattern. It has slipped below the neckline of $1.
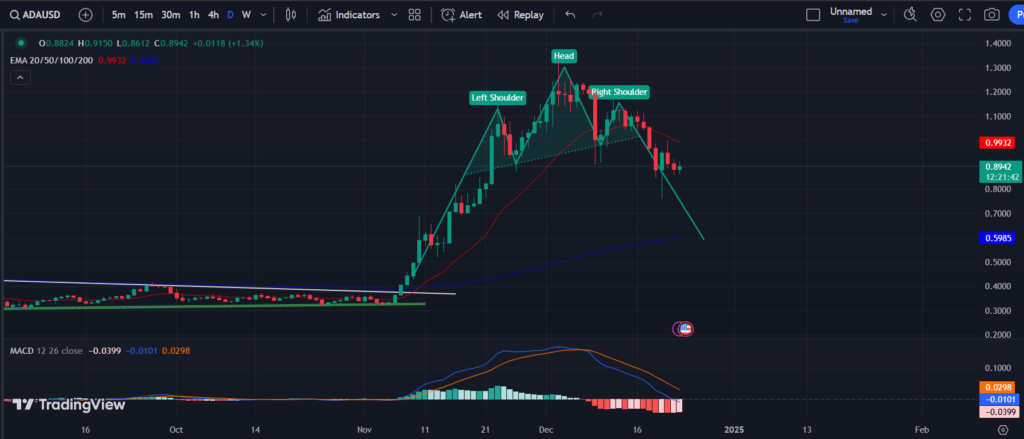
If the price manages to hold below the $1 mark, buyers might lose momentum. The ADA price is expected to lose more points as per the technical chart. If buyers fail to bounce back, it may melt to the 200-day EMA. Once the price starts trading below the 200-day EMA, a bearish trend could be initiated.
Conversely, if the ADA Cardano price bounces back and exceeds the $1 mark, buyers might participate. If the price sustains over the $1 mark, the price may head for the last swing high. Once the price exceeds the $1.20 mark, another bullish rally can be anticipated.
RSI remains below the RSI-based moving average. The MACD and signal line have sharply dropped below the Zero line. The histograms have turned red which showcases the bearish forecast.
ADA Price Analysis Based on Chart Structure
The recent performance of Cardano reveals a pivotal moment for traders. Following a significant decline of 31.72% from its monthly high, the current market sentiment indicates a potential consolidation period after aggressive selling. Although bulls have struggled to regain momentum, the reduced selling pressure could present an opportunity for a bullish rebound.
Ultimately, ADA’s ability to reclaim and maintain the $1 level will be critical. If buyers step in and drive the price above $1.20, a renewed bullish rally could follow. Conversely, continued bearish pressure and a drop below the 200-day EMA would signal a more pronounced bearish trend. Investors will need to remain vigilant as the market dynamics unfold in the coming days.
Disclaimer
This article is for informational purposes only and provides no financial, investment, or other advice. The author or any people mentioned in this article are not responsible for any financial loss that may occur from investing in or trading. Please do your research before making any financial decisions.




