
 Altai the Tiger
 IGNITION
 streamoors
 Sword Inu
 NEAR Protocol
 Injective
 Quantus
- Analyst predicts XRP could rally to $3.70, with support holding at $1.98–$2.00 range.
- XRP price could see an upsurge as it replicates a symmetrical triangle pattern.
Ripple (XRP) price has been experiencing a notable surge in market value over the last three days, trading at $2.41, marking a rise over 1.10% over the past 24 hours, and extending its weekly gains to nearly 10% at press time.
This buying spree with the broader bullish market sentiment in the crypto market drawing increased attention. Apart from the positive market trend, XRP crypto formed a major bullish pattern, which can lead to a bull rally.
Symmetrical Triangle Pattern Suggests Upsurge Ahead
The recent weekly rise over 10% has left analysts talking while betting big on the XRP’s future.
In a recent tweet on X, EGRAG CRYPTO highlighted that, XRP price action looks strong and it remained in a steady uptrend.
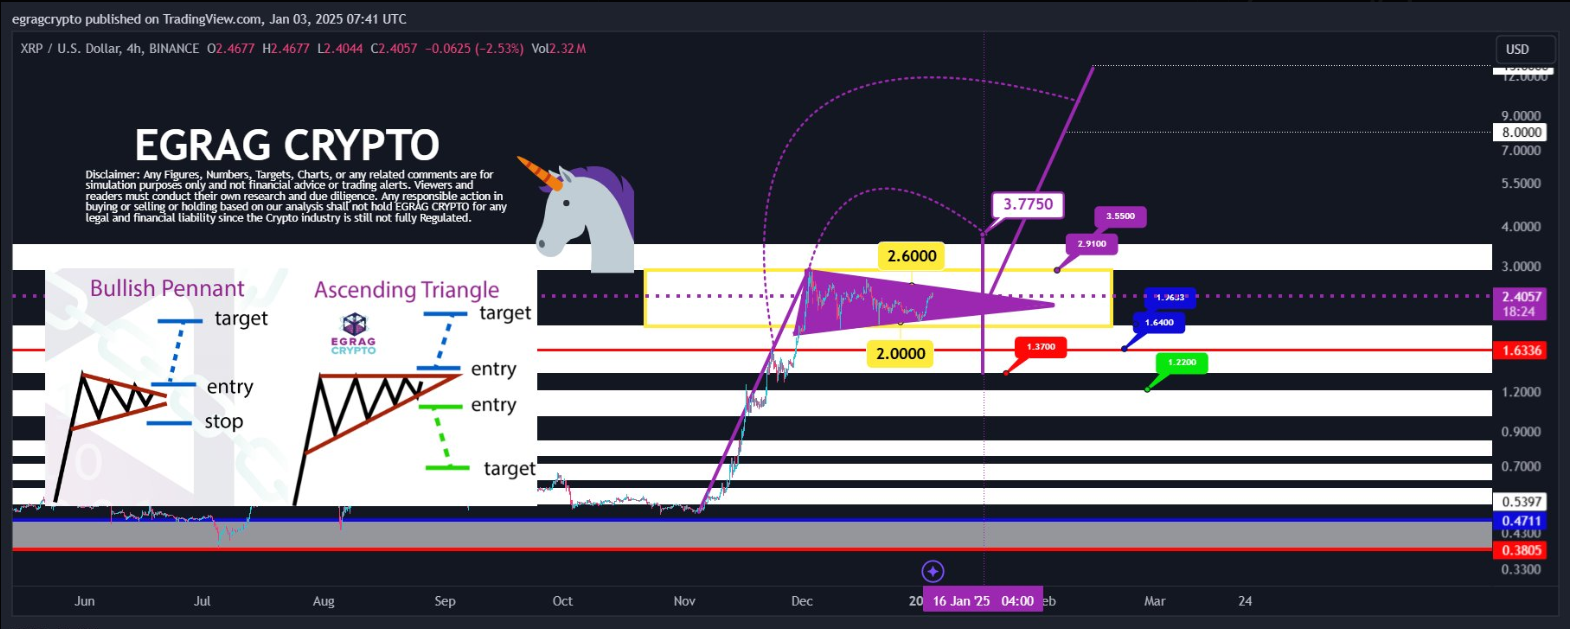
According to the analyst, if XRP price breaks the upward trendline hurdle, it could go towards the $3.70 – $4.20 range and also confirm the bullish pennant structure.
The bullish pennant pattern comes with a massive upside target of $13 in the short term. However, investors should watch closely on the $8 – $10 range for booking their profits strategically.
Moreover, prominent crypto analyst, Captain Faibik predicts a 50% upside target for XRP.
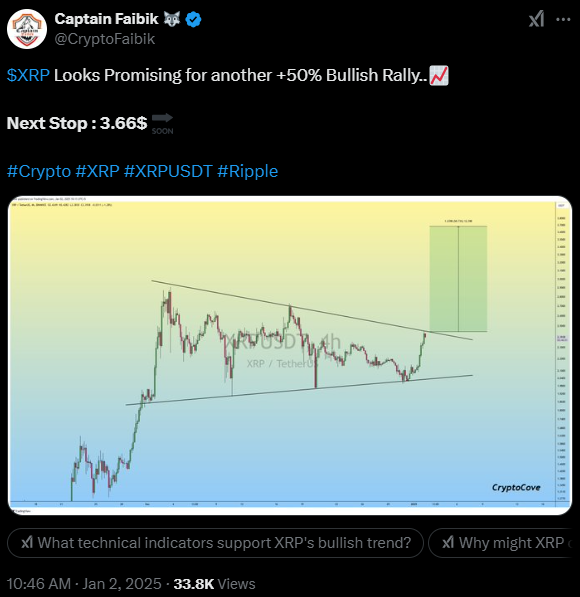
He said that XRP formed a symmetrical triangle pattern and the chart looks promising. Once it clears the $3 hurdle, a massive upsurge toward $3.66 and $4.20 could be seen in the upcoming sessions.
What the XRP Chart Suggests
While the analysis, provided by EGRAG CRYPTO and Captain Faibik provides a forward-looking outlook for XRP, it’s essential to determine other fundamentals signals.
Following the weekly price surge of over 10%, XRP’s network activity suggests that the rally could be sustainable with the potential for continued growth.
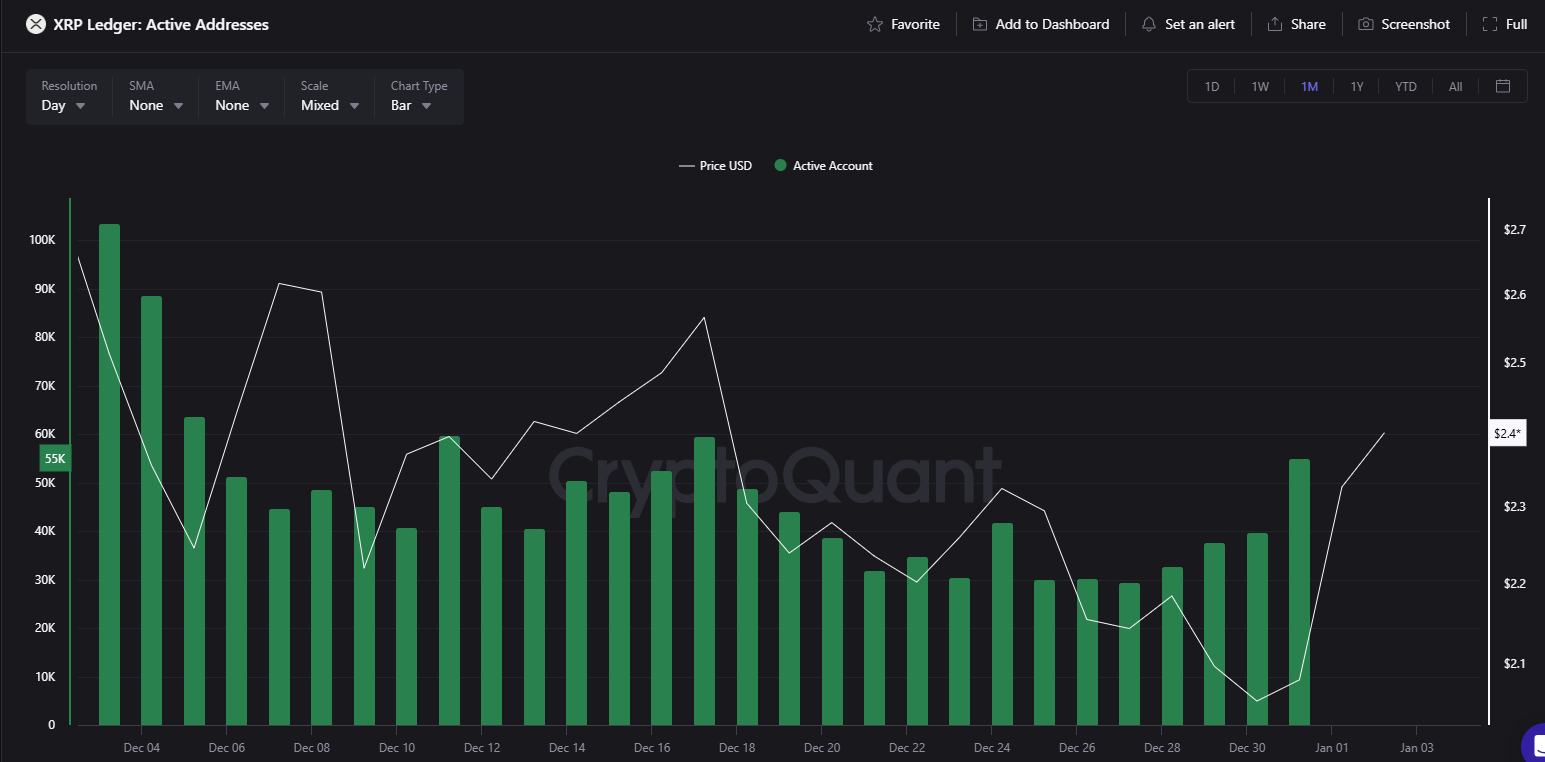
Over the past seven days, XRP’s active addresses rose over 8.90%. This increased demand and growing adoption for the network favor the bullish outlook for XRP.
XRP’s price action signifies a continued bullish trend. The Relative Strength Index (RSI) line had a reading of 60, conveying a bullish sentiment and a positive crossover was noted.
Additionally, the On-Balance Volume (OBV) shows heightened accumulation, as the curve rose higher on the chart.
What Does Derivative Data Suggest
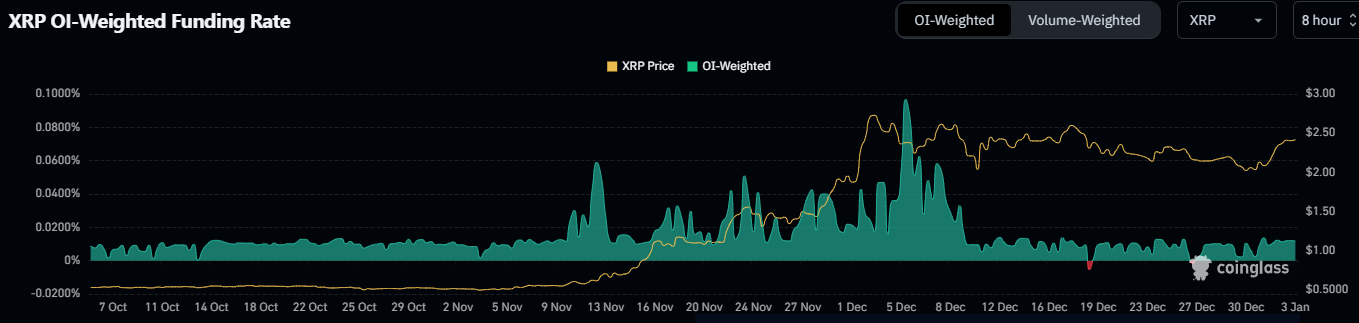
Data from CoinGlass shows that XRP demand for long positions has been rising, as evidenced by the positive OI-weighted funding rate.
At press time, the funding rate stood at 0.0116%. It signals investors confidence with the further upside movement and anticipates a bull rally ahead.
Moreover, the Open Interest (OI) has risen over 1.47% to $2.56 Billion, which implies a long buildup activity in the past 24 hours.
The immediate support zones were $2.10 and $1.80, whereas the upside hurdles were $2.80 and $3.20.
Disclaimer
This article is for informational purposes only and provides no financial, investment, or other advice. The author or any people mentioned in this article are not responsible for any financial loss that may occur from investing in or trading. Please do your research before making any financial decisions.




