
 Altai the Tiger
 IGNITION
 streamoors
 Sword Inu
 NEAR Protocol
 Injective
 Quantus
- Analysts predict Ethereum price could hit $6,000 in Q1 2025 amidst a bullish pattern.
- The higher timeframe setup was bullish and large gains were likely.
Ethereum price displayed sideways movement over the last three days. Amidst the crypto market selloff, ETH price managed to hold the gains above the $3000 support zone and defended the 100-day EMA mark.
At press time, Ethereum price was $3254, trading relatively flat during the intraday session. Its market cap stood at $392.06 Billion with a total supply of 120.49 Million.
Despite the weekly decline of over 10%, ETH price chart looks strong and could show a rebound shortly. Moreover, the turbulence is unlikely to flip the ongoing bullish trend. Essentially, ETH price action still represents a bullish outlook.
Will Ethereum Price Reach $6000 in Q1 2025 — Analysis
Ethereum price is trading inside an ascending channel and is persistently forming higher high swings on the daily timeframe. If it follows this channel and gains momentum, it could see an upswing toward the $6000 mark in the upcoming sessions.
However, the critical $2800 support should be watched closely for a decline toward the lower end of the channel.
Moreover, Ethereum’s 30 day Market Value to Realized Value (MVRV) ratio highlights an oversold status. Historically, such occurrences have triggered accumulation phases where institutional investors or large investors known as whales buy more coins than.
Exchange Reserve Hits Monthly Low: What it Means
Data from CryptoQuant shows that the exchange reserve value has dragged significantly. As it plummets to monthly lows, it signals hope for bullish narrative.
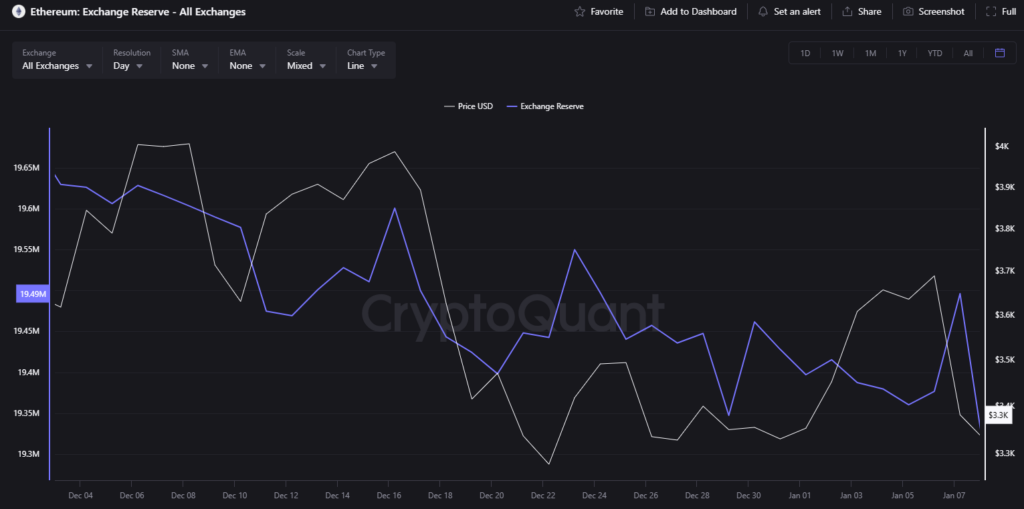
The decline in exchange reserves comes at a time when Ethereum price is struggling at its 100-day EMA mark and could lead to the recovery of recent losses.
Notably, the exchange reserve has dropped to 19.50 Million, which indicates that the supply is diminishing, and that it could facilitate a price surge.
Ethereum Price Analysis: Bullish or Bearish
Per the daily chart analysis, Ethereum price faced significant resistance at $3700 and reverted toward the 50% Fibonacci support zone of $3100.
The Relative Strength Index (RSI) was at 41, slightly below the neutral 50 level, reflecting mild bearish momentum on the chart.
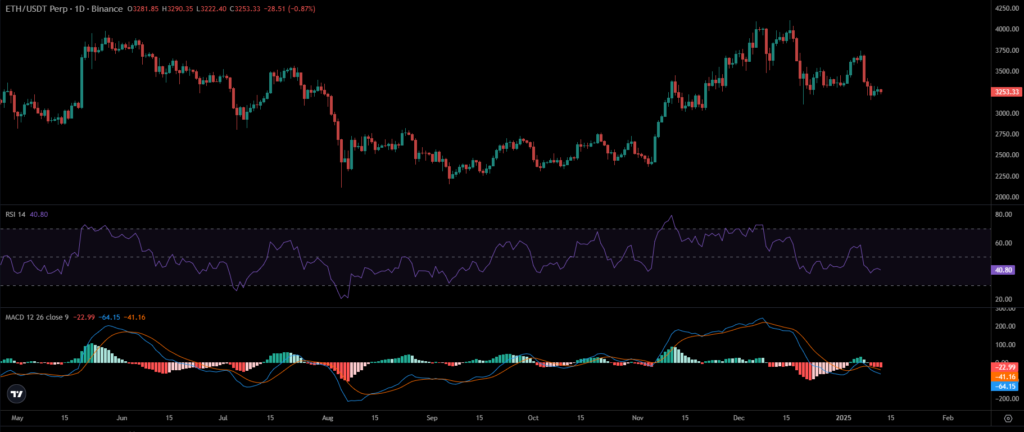
The Moving Average Convergence Divergence (MACD) was negative at -21, highlighting a bearish crossover on the chart.
Despite the bearish indicators on Ethereum’s chart, a hope for the bullish revival was imminent.
Market speculators reacted negatively to ETH’s sideways movement, as the Open Interest (OI) continued to drop. Data from Coinglass shows that the OI shed over 0.12% intraday and 4.30% in the last 48 hours to $29.20 Billion.
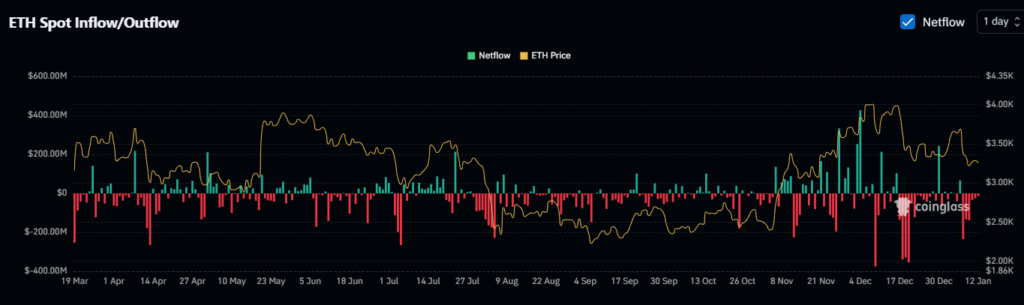
However, the Spot Inflow/Outflow data shows an outflow of over $516 Million over the past seven days. It refers to the withdrawal of assets from exchanges to wallet and hints at possible upward momentum in the coming days.
The immediate support zones were $3180 and $3000, whereas the resistance hurdles were $3680 and $3800.
Disclaimer
This article is for informational purposes only and provides no financial, investment, or other advice. The author or any people mentioned in this article are not responsible for any financial loss that may occur from investing in or trading. Please do your research before making any financial decisions.




