
 Altai the Tiger
 IGNITION
 streamoors
 Sword Inu
 NEAR Protocol
 Injective
 Quantus

Key Insights:
- BTC cost basis clusters form around $84K with 110,000 BTC.
- $95K resistance builds with 12,000 BTC added since March 24.
- Technicals suggest possible breakout above 50-week EMA.
Bitcoin’s on-chain cost basis data shows strong support forming at $84K and resistance forming at $95K. With momentum indicators starting to turn bullish and long-term holders starting to step in at lower levels, BTC may be gearing up for its next move.
Short-Term Support Levels Repositioned
According to Glassnode data, three support clusters have been formed between $80,920 and $84,100. Now, these price levels have a combined 110,000 BTC. In particular, 40,000 BTC are at $84,100, 50,000 BTC at $82,090, and 20,000 BTC at $80,920.
As Bitcoin retraced back towards $84,000, trading activity was concentrated around these areas, as seen in the heatmap. Traders and investors seem to have added positions, which are providing short-term price cushions.
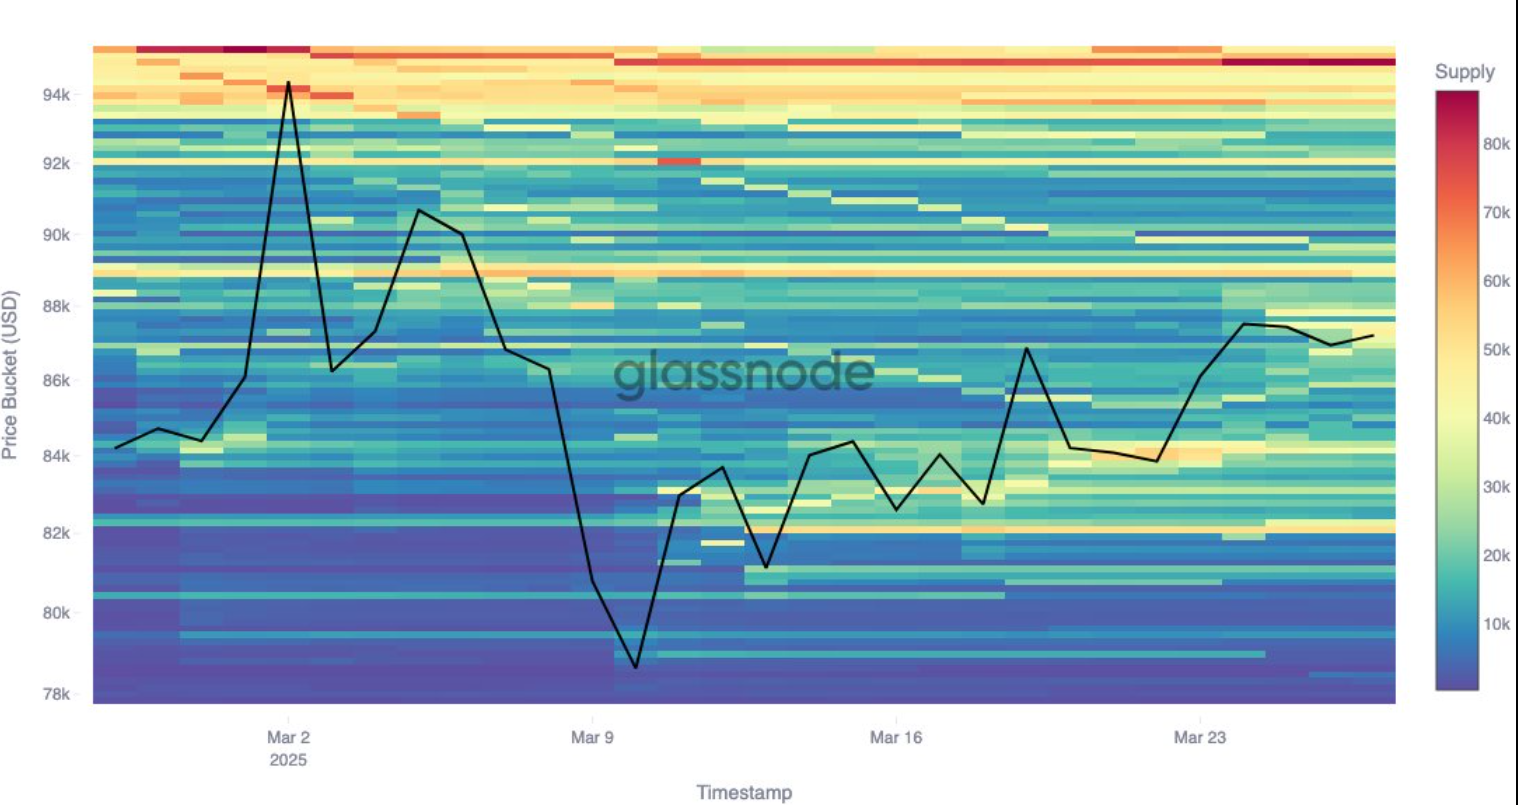
Unlike earlier levels like $78,000 for example, where around 15,000 BTC were bought on March 10 and sold at $87,000, these clusters are newer and might still be tested in the near term.
The BTC bought there, most of them have been sold, so there are fewer holders at that cost basis. That could make it harder for future dips below $80,000 to be absorbed without renewed demand.
$95K Emerges as New Resistance Zone
Not only are support zones forming, but investor positioning is also creating resistance above current price levels. According to Glassnode data, the cost basis clusters at $95,000 have grown by 12,000 BTC since March 24.
Moreover, this area is more dense with yellow and red bands in the larger heatmap view. These are high supply concentrations. Traders who bought near $95,000 could be looking to exit or break even and could add selling pressure if the price gets back to that level.
Since the March 10 high, Bitcoin’s price has remained below $90,000, indicating that sellers are present between $87,000 and $95,000. Volume will be needed to drive through these layers, and any upward move will have to overcome this resistance.
Longer-Term Support Sits Near $74K and $71K
Furthermore, according to Glassnode, structural support could be found below $80,000 if Bitcoin sees a deeper correction. Two lower clusters are at $74,000 and $71,000. Around 49,000 BTC and 41,000 BTC are held in these areas.
The clusters were built over the past six months. The heatmap show supply started to accumulate in these areas before the recent uptrend. This kind of buying implies conviction in positioning by investors who are willing to hold through cycles of price.
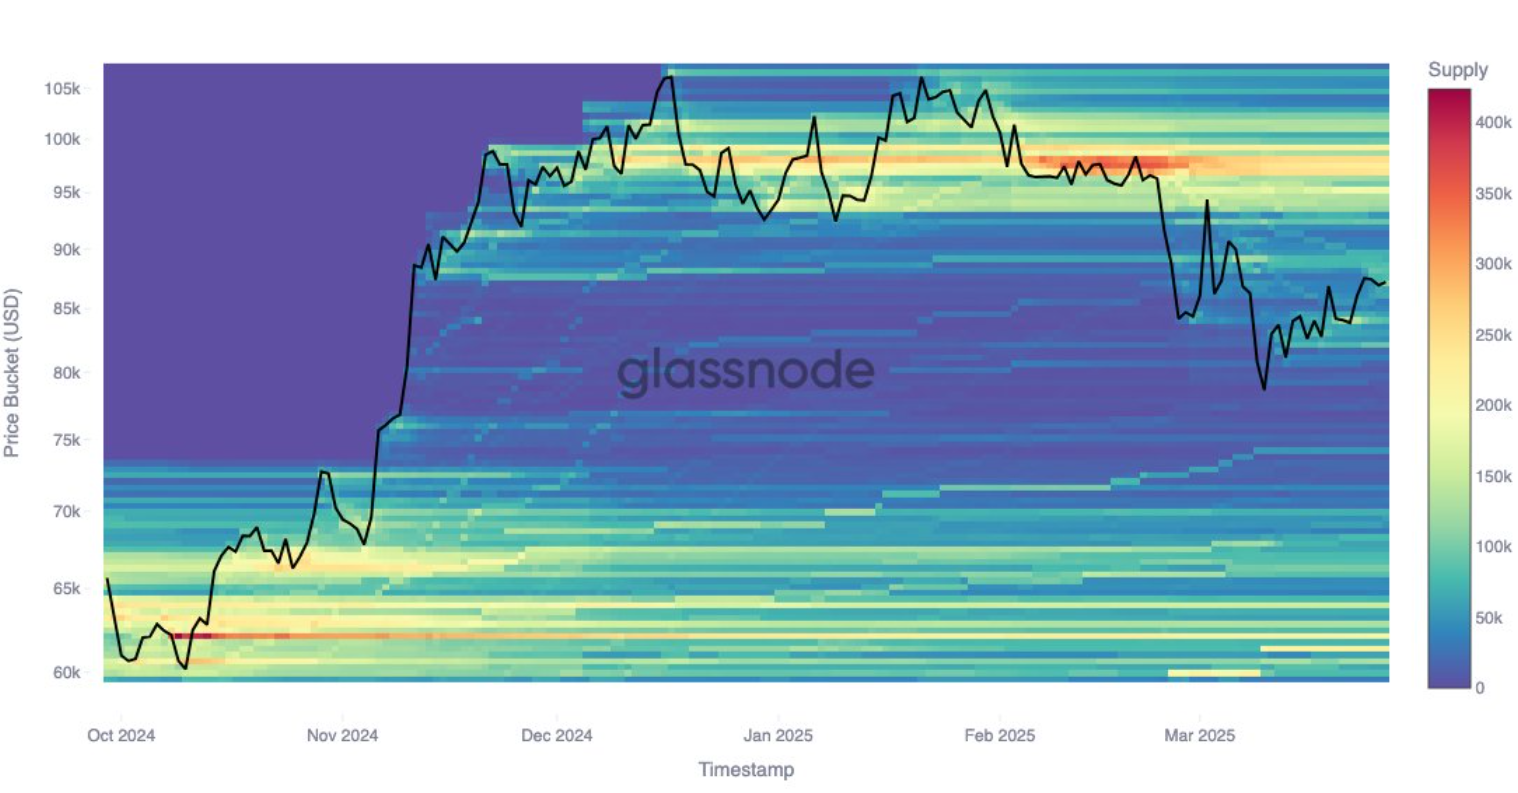
At these levels, they could be zones where buyers can step in again if the price falls sharply, given the amount of BTC held at these levels.
Technical Indicators Suggest Momentum May Shift
Meanwhile, in a chart shared by analyst Merlijn The Trader, several momentum indicators are now turning upward. The RSI, Stochastic Oscillator and MACD all show past setups where similar patterns preceded strong rallies.
In the last two similar formations, Bitcoin rose 180% and 96% from midrange levels to new highs. Although this does not mean it will happen again, these patterns are now being followed by traders as signals of a possible trend reversal.
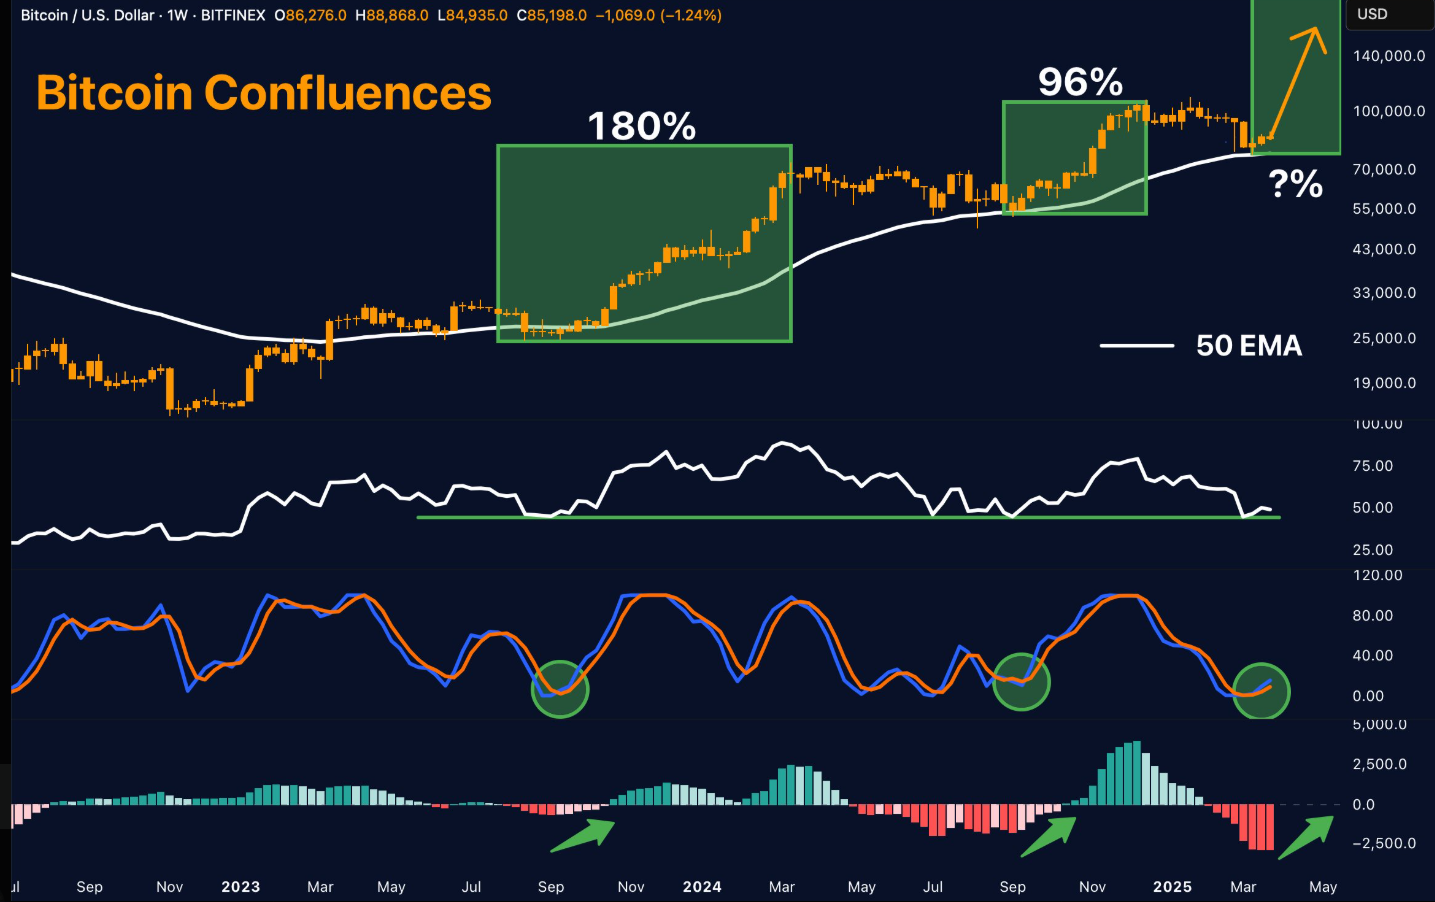
Price is also above the 50-week exponential moving average (EMA), which has acted as support for long rallies in the past. The current setup mirrors past moves in 2023 and mid-2024, which could be a possible breakout attempt as shown on the chart.
Conversely, Bitcoin is stuck between growing supply clusters and historical support, as both technical and on-chain data line up at key levels. Traders are looking at $84,000 as a near-term pivot, $95,000 resistance and $74,000 structural support.
Disclaimer
This article is for informational purposes only. Crypto investment involves inherent risks due to the volatility in price. Readers should conduct their research before making any investment decision. Also, you can consult a crypto expert before investing in cryptocurrencies.




