
 Altai the Tiger
 IGNITION
 streamoors
 NEAR Protocol
 Sui
Sui Ethereum
 Pudgy Penguins

Key Insights:
- ETH is down 57% from ATH but holding critical long-term support.
- Analysts project a rally to $10K by late 2025 after accumulation.
- Technical patterns hint at a potential breakout from current levels.
Ethereum price remained under pressure near $1,837, testing a long-term support zone. Analysts evaluated whether the asset could maintain its broader uptrend. Despite a weak start to 2025, several chart patterns and macro-cycle forecasts indicated a possible recovery. A new all-time high might form by the end of next year.
Historical Cycles Suggest Ethereum Price Could Reach $10,000 by Q4 2025
According to market analyst CryptoPatel, Ethereum may be following a recurring pattern seen in previous Bitcoin halving cycles. The 2016 and 2020 Bitcoin halvings were followed by extended Ethereum rallies, with the asset increasing 228x and 27x, respectively. Ethereum’s current decline of 57% from its all-time high is similar to earlier post-halving dip.
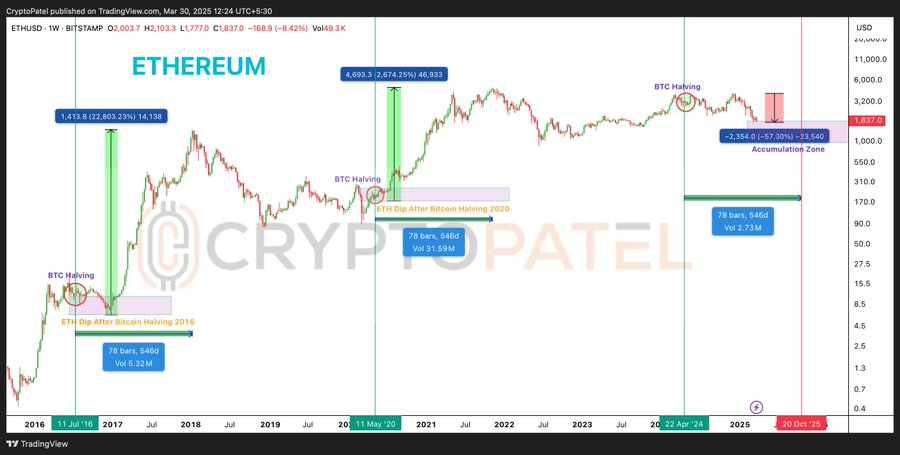
Following CryptoPatel predictions, ETH is expected to go to $7,000 to $10,000 worth by the fourth quarter of 2025. Historical Fibonacci extensions and macro trend alignments are what his outlook is based on. It trades at $106 in September, 2020, pointing to a halving cycle following the pattern of that accumulation zone lasting about 546 days after each halving, thus possibly being in that phase now. Under a repeat of history, parabolic breakout could kick off in late Q3 – Q4 2025.
Ethereum Price Structure and Long-Term Moving Average in Focus
On the weekly chart, Ethereum is right now testing the 200-week moving average, the level which investors on the longer term keep their eye on. During the past macro corrections this moving average has served as support. If $1,720 is broken to the downside, we may look at further downside with a target at $1,500 – $1,600.
MikybullCrypto has emphasized on this level. As per his analysis, Ethereum must close above the moving average to not worsen this situation. Moreover, he confessed that if ETH doesn’t make a new all time high in the current cycle it will be his worst-performing investment.
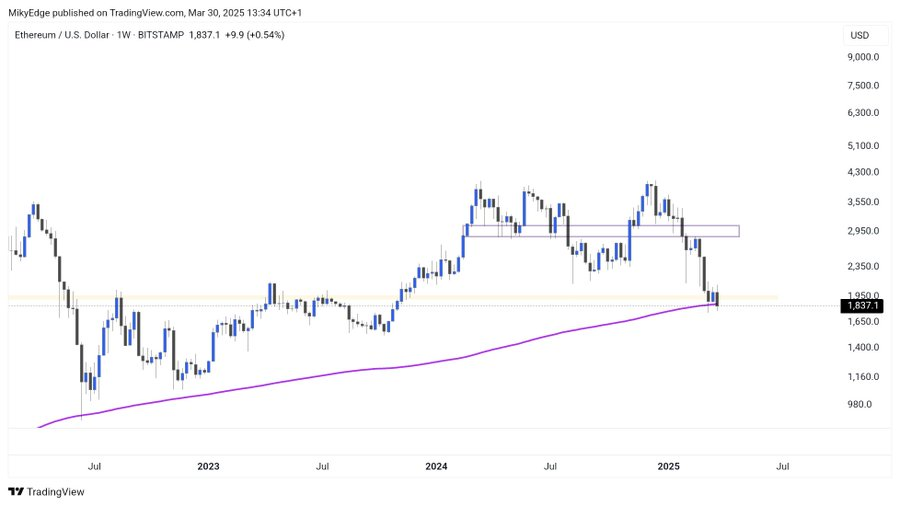
It is now acting as resistance in the area of $2,950 and $3,550. It previously entertained Ethereum’s uptrend but now sits on price recovery. To build a bullish structure with a higher target, Ethereum has to reclaim this level.
Falling Wedge on Daily Chart Points to Possible Reversal
On the daily chart, Ethereum (ETH) appeared to form a falling wedge pattern. This structure typically signals a bullish reversal once a breakout is confirmed. Since Jan., ETH created lower highs and lower lows within converging trendlines.
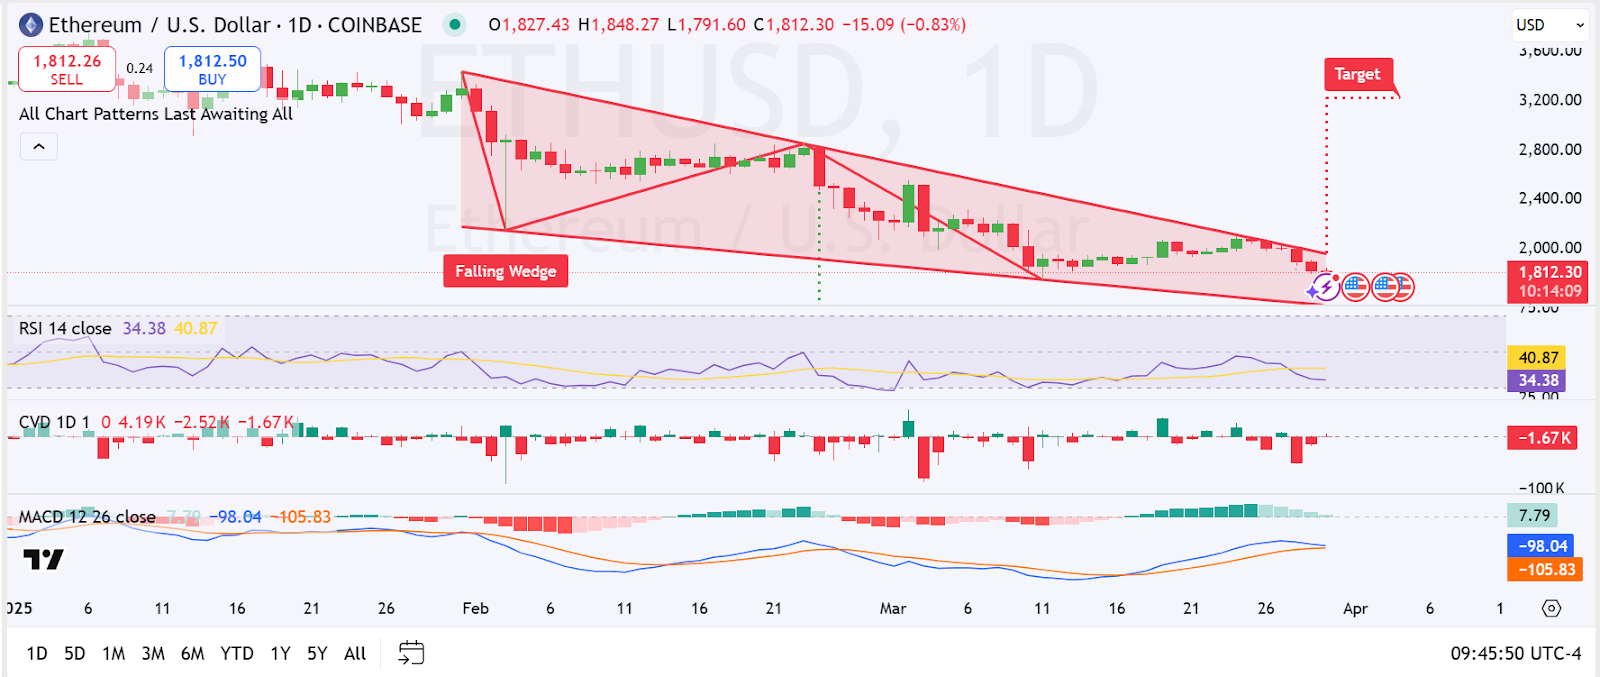
ETH hovered near $1,812, approaching the wedge’s upper boundary. The Relative Strength Index (RSI) stood around 34, indicating oversold conditions. This suggested selling pressure might be weakening.
The MACD also hinted at a bullish crossover. Histogram bars showed increasing buyer momentum. If ETH breaks above the wedge with volume support, the price might target $3,200, based on the wedge height.
Traders watched for a daily close above the upper trendline to confirm the reversal.
Market Sentiment and Institutional Developments
U.S. banks showed interest in Ethereum, which could strengthen institutional adoption. Still, market sentiment remained fragile. According to CryptoRank, ETH dropped from $2,850 to $1,840 following a tweet by Eric Trup, showing how sentiment continues to drive price.
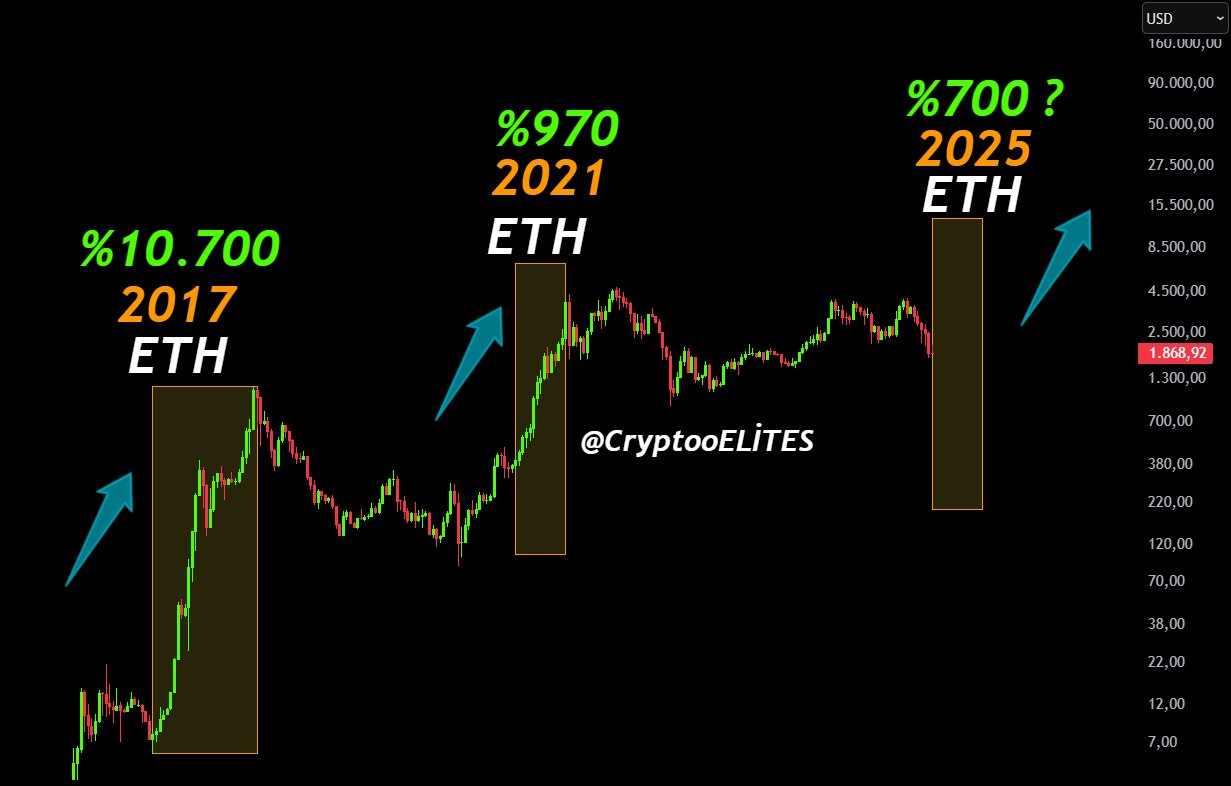
Furthermore, market analyst CryptoELiTES compares Ethereum’s past cycles, showing gains of 10,700% in 2017 and 970% in 2021with the current setup. According to the analyst ETH is in a similar pre-rally phase and could rise up to 700%, targeting $15,000 by the end of 2025.
Disclaimer
This article is for informational purposes only and does not provide any financial, investment or other advice. The author or any people mentioned in this article are not responsible for any financial losses that may arise from investing or trading. Please do your own research before making any financial decisions.



