
 streamoors
 Altai the Tiger
 Sword Inu
 IGNITION
 no crying in the casino
 Quantus
 NEAR Protocol

Key Insights:
- Litecoin is nearing a critical support level at $50-$55.
- The Fed’s lack of action heightens market volatility.
- A potential trend reversal could occur if the support zone holds.
Litecoin price has experienced some notable fluctuations recently, which has been keeping traders and investors on the edge. The asset’s open interest has dropped 5% in the past 24 hours. This indicated that traders were rushing out of the market.
Volatility in the LTC market continues with the approach of a crucial support zone between $50 and $55. According to recent market analysis, if this support level holds, it could pave the way for a potential bullish reversal.
However, the market’s future movement is contingent on external factors. This included broader economic conditions and the Federal Reserve’s stance.
Litecoin Nears Key Support: Analysts Predict Bullish Reversal
Litecoin price has experienced considerable downward pressure in recent months. Its recent price drop brought the cryptocurrency near the critical $50-$55 support range.
Historical data showed that LTC has bounced off this support level several times, making it a key support zone.
While the price of Litecoin has plummeted, according to AMCryptoAlex, the sudden fall is regarded as a ‘Black Swan.’ This brought about an unprecedented and unusual market change, leading to a sharp downfall.
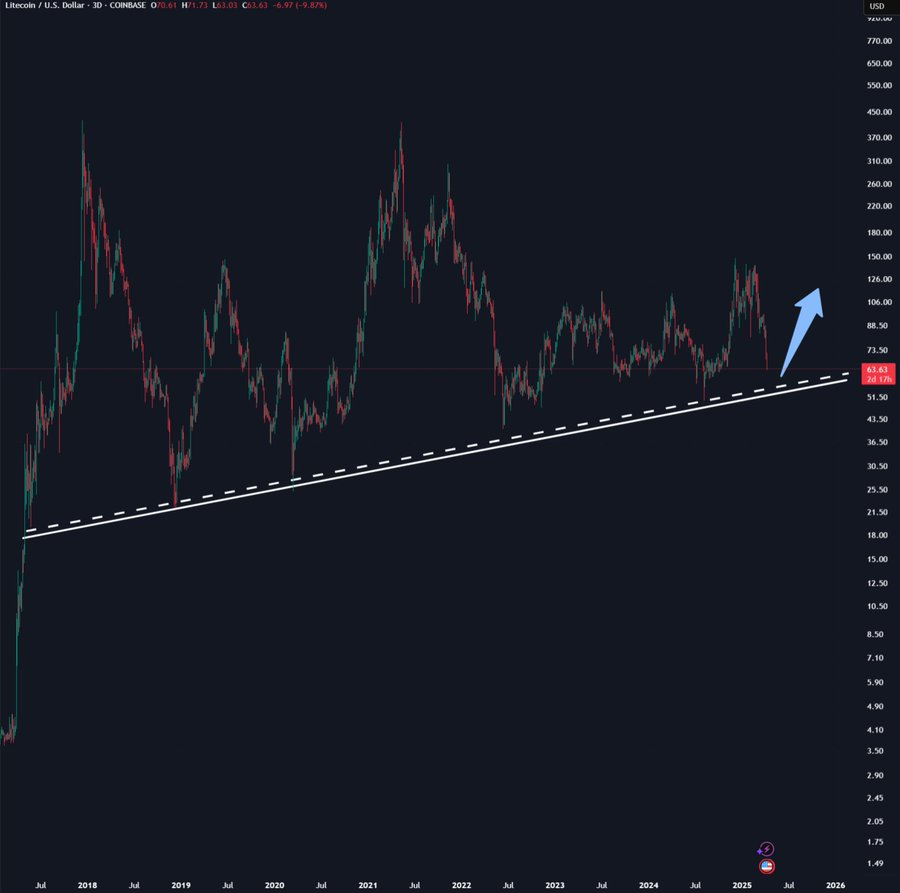
AMCryptoAlex notes that the market remains uncertain due to the Federal Reserve’s reluctance to intervene. As a result, the market continues to fluctuate unpredictably.
Traders eagerly anticipate the Federal Reserve’s subsequent actions. In the meantime, the market is expected to experience continued Litecoin price swings and potential short-term declines.
Litecoin Price Falling Wedge Pattern and Potential Breakout
LTC displayed a falling wedge pattern in the daily chart, indicating a bullish reversal. The price is forming lower lows and higher highs. However, the downtrend was easing.
Analysts predict that if Litecoin price breaks above the upper trendline, the next move will be $120. It’s trading near the lower trendline, making it a crucial support zone. A breakout above a trendline could lead to significant upward movement if momentum shifts.
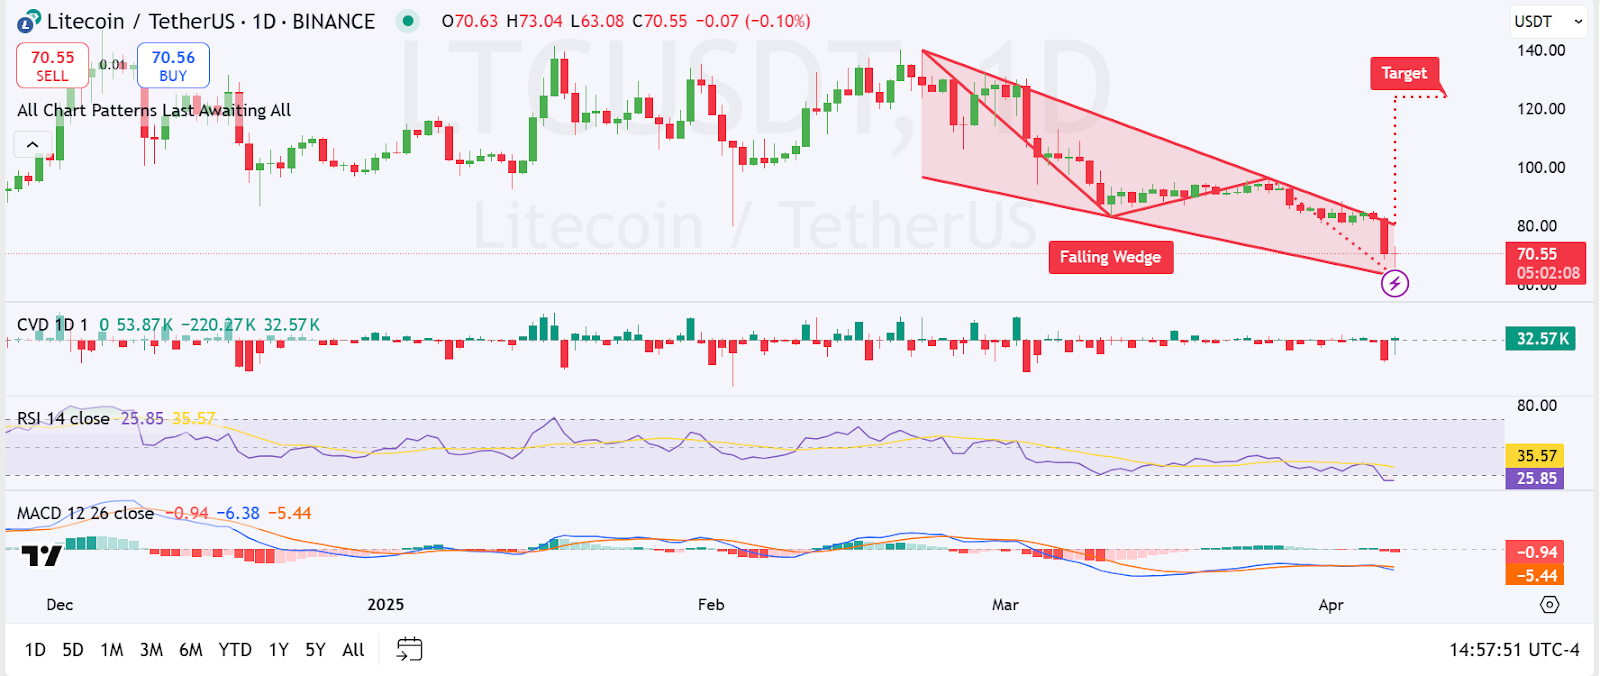
The Relative Strength Index (RSI) for LTC is currently at 25.85, indicating an oversold condition. This suggested Litecoin may be poised for a potential bullish rebound soon.
The MACD line is below the signal line, indicating negative momentum. The histogram continues to be negative, indicating more bearish momentum.
However, as the histogram shrinks, it suggests that bearish momentum is losing steam. If the trend persists, a momentum shift to the upside might happen. This could occur when Litecoin price rises above the upper trendline of its falling wedge pattern.
Meanwhile, Cumulative Volume Delta (CVD) has a positive value of 32.57K. This means increasing buying pressure in the market.
The green bars suggested that buyers are beginning to surpass sellers. If prices break above the upper wedge trendline, it may trigger an upward movement.
Litecoin Price Forecast: Projected Increase
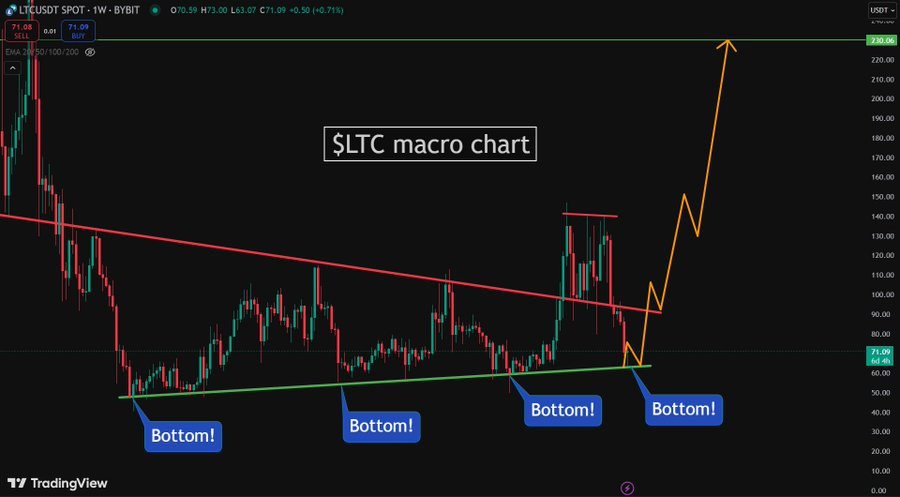
SolbergInvest targets $230 for Litecoin if the price remains above the $60–$70 range. A potential sharp movement in Litecoin may be seen in the next few weeks if momentum continues.
According to the latest Litecoin price prediction, LTC is set to rally to $110.37, a price increase of 264.41% by April 27, 2025. While this situation remains volatile, the current forecast indicates that if the support level persists, Litecoin could see an uptrend.
Technical indicators indicate that bearish sentiment continues to dominate the market. The Fear & Greed Index at 26 reflects heightened fear among participants.
LTC has recorded 15 green days out of the last 30, achieving a 50% positive performance rate. During this period, its price volatility stood at 11.99%. This recent performance highlights the market’s unpredictable nature, and traders are waiting for signs of a potential recovery.
Disclaimer
In this article, the views and opinions stated by the author or any people named are for informational purposes only, and they don’t establish the investment, financial, or any other advice. Trading or investing in cryptocurrency assets comes with a risk of financial loss.




