
 streamoors
 IGNITION
 Injective
 NEAR Protocol
 Pearl
Pearl LayerZero
 Hyperliquid

Key Insights:
- BTC jumps 9% to $83,294 after bouncing off $74K support
- Resistance between $84K–$87K challenges further price gains
- Death cross and sell signals reflect broader trend caution
After dropping below $75,000, Bitcoin surged over 9% to reach $83,294, indicating a short-term recovery. Yet, with strong resistance at $84K–$87K and a recent death cross on the chart, the bigger picture still calls for caution in the coming days.
Strong Bounce as BTC Recovers from $74K Lows
After falling below $75,000 earlier this month, Bitcoin bounced back sharply. The token closed at $82,594 on April 9, 2025, up more than 9% on the day. It came after a steep decline that had taken it down from a peak near $100,000 earlier in 2025.
Bitcoin price surged above the $78,000 support level that had held during multiple tests during the recent downtrend. It helped restore short-term confidence after weeks of selling pressure.
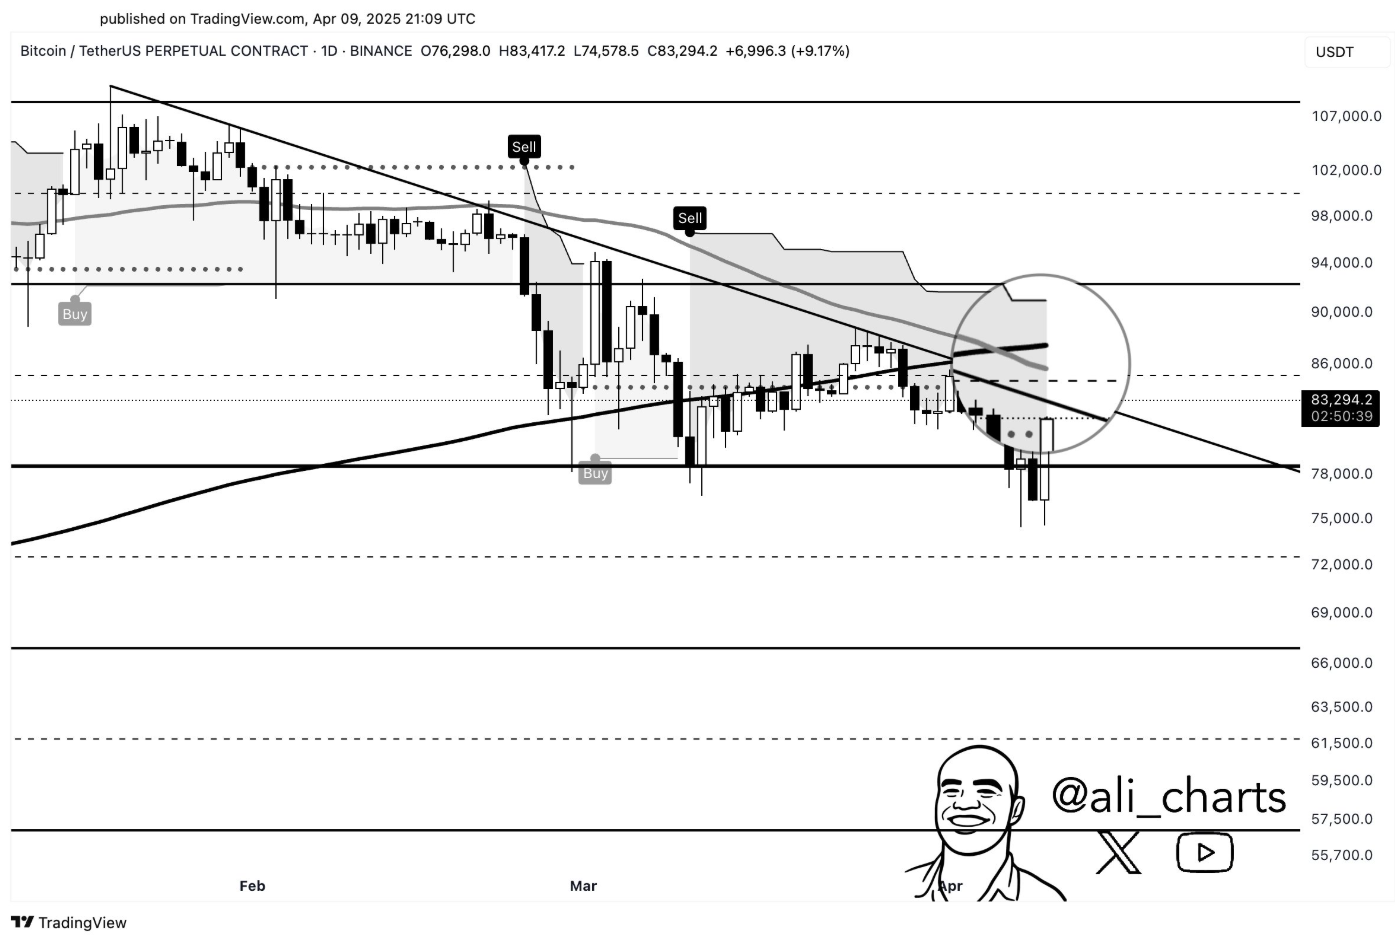
But as Ali shares in the chart, there is still caution ahead. On the daily chart, there is a “death cross”—a technical signal where the 50-day moving average falls below the 200-day moving average. If momentum doesn’t follow through, this pattern often means further weakness. Bitcoin’s 50-day MA is around $85,800 and 200-day MA is around $87,000.
Resistance Zones Near $84K–$87K Pose a Challenge
Conversely, Bitcoin is now approaching a critical confluence of resistance levels. The early barrier is around $82,500, which is the monthly open. Price is also struggling against a descending trendline from its all-time high, which is just around $84,000.
There is a zone where sellers have stepped in before, and the SuperTrend indicator is still showing a ‘Sell’ signal on the daily timeframe, indicating that the market is still cautious. On higher time frames, Bitcoin would need to break clean above $87,000 to reverse this trend.
This resistance zone is being watched by traders. A rejection here could see BTC return towards the $78,000–$75,000 support band, while a breakout would open the way to $90,000 and beyond. The price is still within a larger consolidation range.
Broader Market Structure Shows Falling Wedge Pattern
Beyond Bitcoin, the rest of the crypto market is also indicating a possible recovery. Analyst CryptoBullet chart of the total market cap excluding Bitcoin (TOTAL2) shows a falling wedge pattern. This is a bullish structure where the price narrows down into a wedge and often breaks out to the upside.
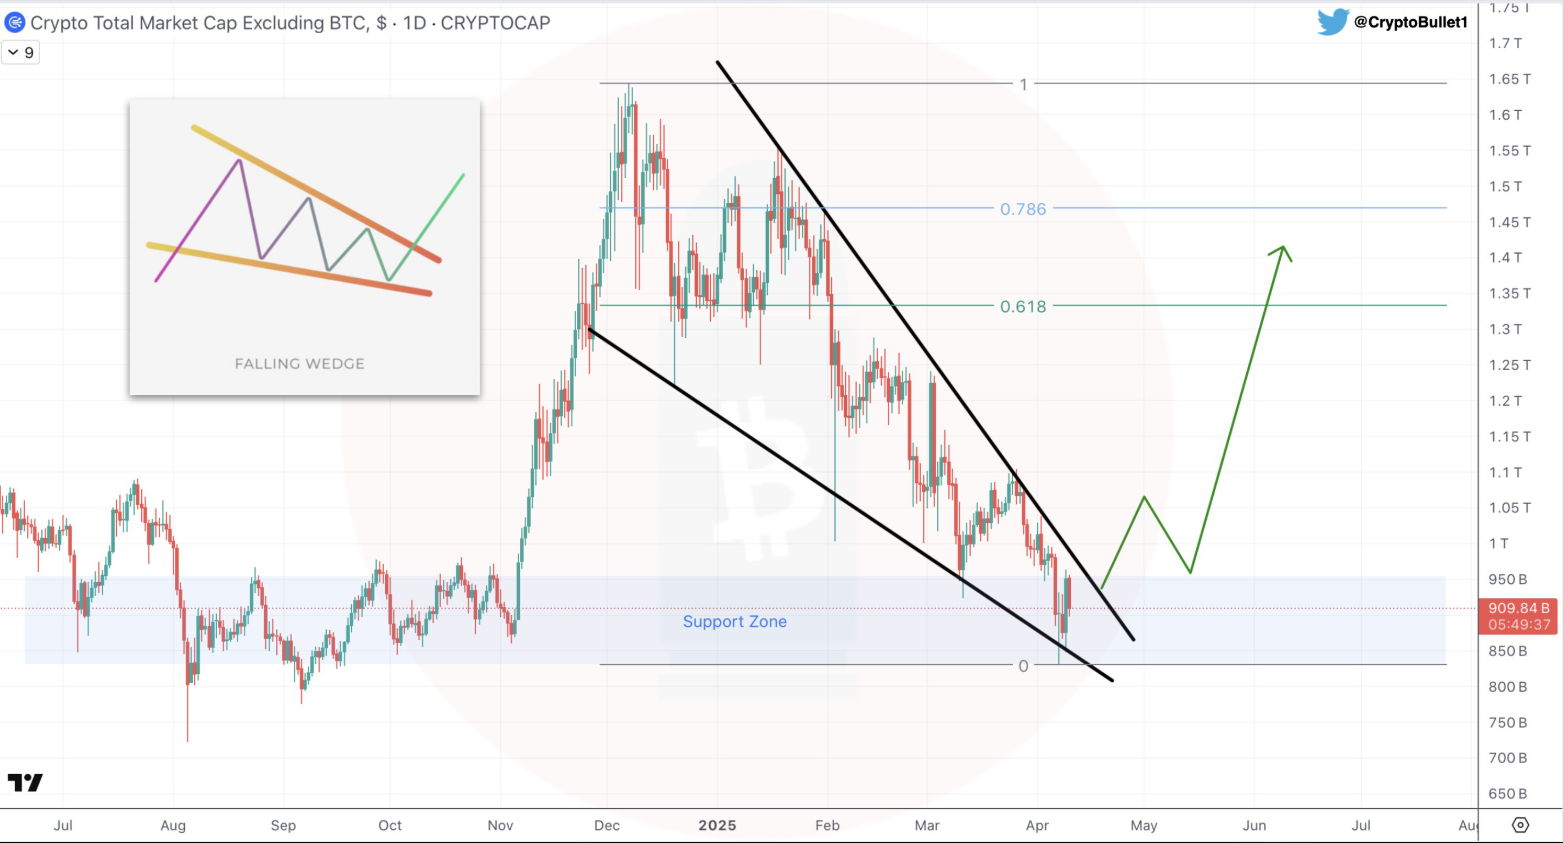
At the time of this writing, TOTAL2 is trading close to the $910 billion mark, slightly above a large support zone between $850 billion and $900 billion. This area has held since mid-2024.
However, if TOTAL2 breaks out of this wedge, the target could be at the 0.618 Fibonacci level, which is approximately $1.35 trillion. That would be a roughly 50% increase from current levels.
Bitcoin’s long-term support indicator is the 50-week EMA and market participants are also watching that. Should Bitcoin hold above this level, the wider market may continue to recover with it.
Signs of Seller Exhaustion Begin to Emerge
Prices have dropped in recent weeks, but data indicates that losses may be beginning to slow. As per Glassnode, during the drawdown, Bitcoin investors had to contend with realized losses of up to $240 million in 6-hour windows. These are among the biggest losses seen in this cycle.
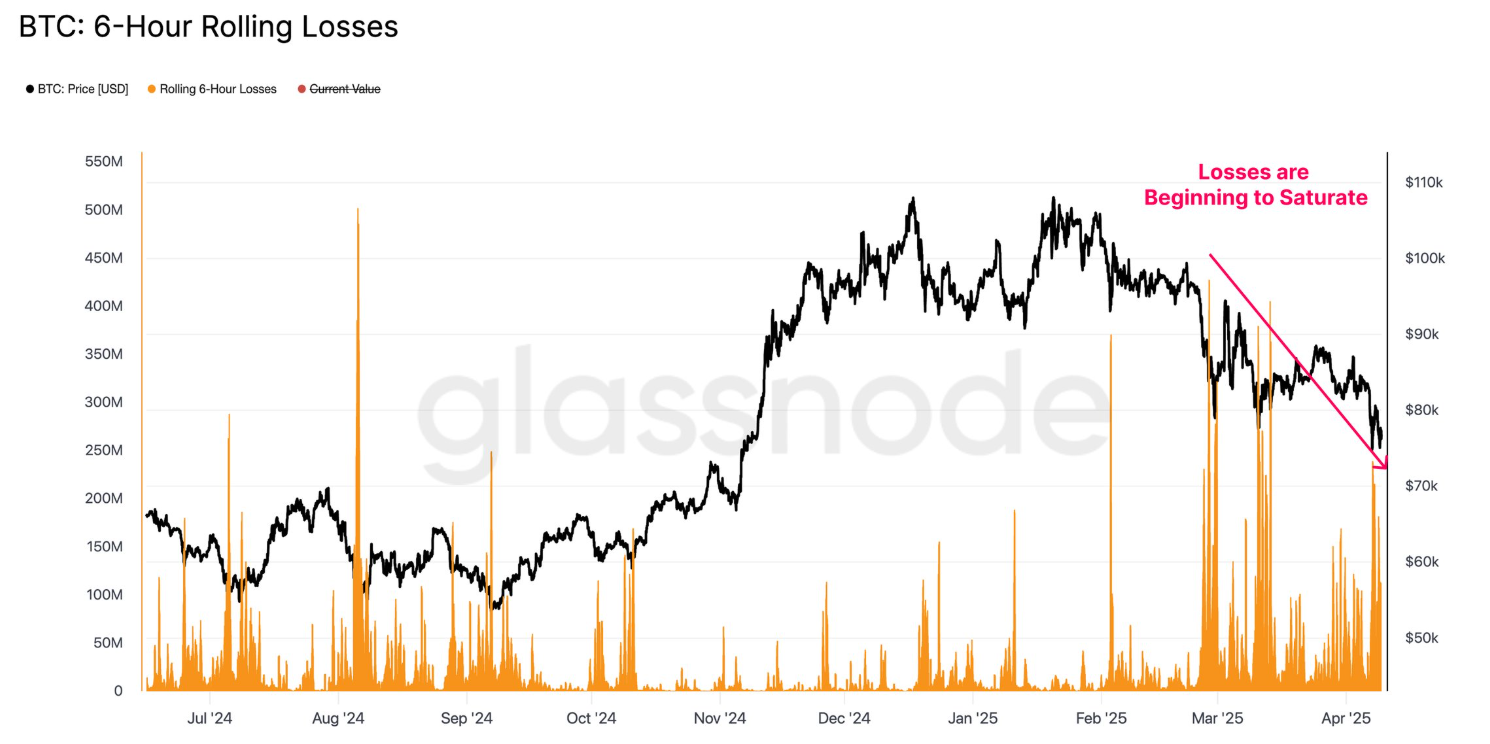
But each successive price dip resulted in smaller realized losses. The selling pressure appeared to be weakening, which this trend suggested. That could have enabled a more stable recovery as the market absorbed the selling and fewer traders locked in losses.
This aligned with the recent bounce in Bitcoin and the wider market showing early support. If buyers continued stepping in and resistance levels were broken, recovery could continue.
Disclaimer
In this article, the views and opinions stated by the author or any people named are for informational purposes only, and they don’t establish the investment, financial, or any other advice. Trading or investing in cryptocurrency assets comes with a risk of financial loss.




