
 streamoors
 Altai the Tiger
 Sword Inu
 IGNITION
 no crying in the casino
 Quantus
 Pearl
Pearl

Key Insights:
- A descending broadening wedge breakout above $18.50 may trigger a bullish rally, with potential upside toward the $30 level.
- LINK faces key resistance at $16.48–$17.62, aligning with major Fibonacci levels, indicating a likely sell zone in current wave (B).
- A break below $14.65 could confirm wave (C) continuation, with downside targets at $13.94 and $11.42 acting as major support zones.
Chainlink (LINK) price is trading within a critical technical structure that may shape its medium-term direction. A descending broadening wedge pattern has developed over recent months on the 12-hour chart, often seen as a potential precursor to bullish reversals.
However, according to Elliott Wave analysis, the top altcoin is in the midst of a corrective phase that could see further downside before any sustained rally occurs.
The price recently peaked near $19.36, completing a five-wave impulse pattern labeled as wave (1). Since then, LINK has entered an A-B-C corrective structure. Presently, the market appears to be forming wave (B), which could meet resistance in the $16.48 to $17.62 range.
Chainlink Price Wave (B) Resistance and Key Fibonacci Levels
Chainlink (LINK) price upward move within wave (B) is facing technical resistance between $16.48 and $17.62. This zone aligns with key Fibonacci retracement levels from the previous downward move. The 50%, 61.8%, 78.6%, and 88.7% retracements all cluster within this price range, suggesting it may act as a short-term ceiling for bullish momentum.
If LINK fails to close above this resistance area convincingly, it may signal the continuation of the corrective phase, pushing prices lower to complete wave (C).
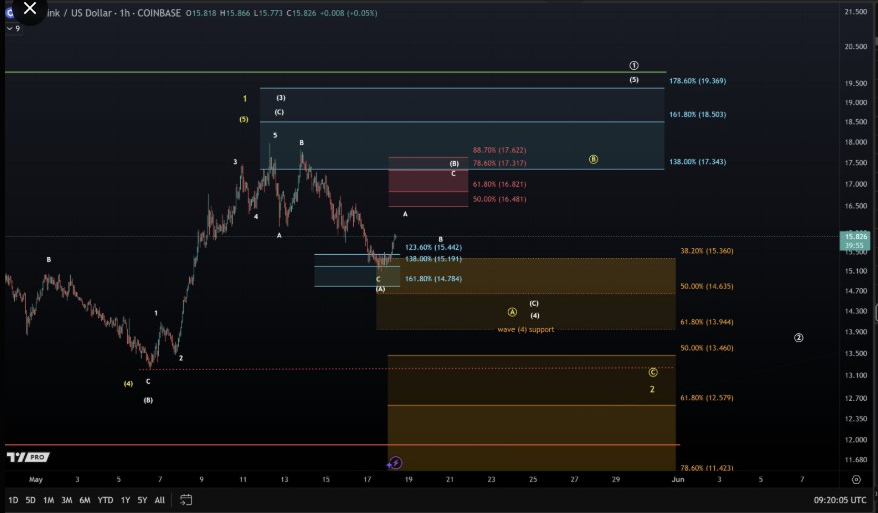
Wave (A) of the correction ended around $14.78. This level also matches the 161.8% Fibonacci extension of a prior minor swing, further strengthening the view that the current move up is a temporary retracement. The overall structure suggests LINK price may still be in the midst of a broader correction rather than initiating a new impulse rally.
Potential Downside Targets if Correction Continues
If LINK gets rejected from the resistance zone near $16.48–$17.62, analysts expect wave (C) to develop next. A break below the $14.65 level would indicate that the downward movement is resuming. In that scenario, the price could target lower support zones at $13.94 and $11.42.
These levels are derived from broader Fibonacci retracement zones and previous price structure. The $14.05 to $13.46 region is labeled as wave (4) support, while the $11.42 area corresponds to wave 2 support. These zones are critical levels where LINK could find temporary support or possibly reverse its course.
The outcome of wave (C) could help form the base for a new impulsive rally in wave (3) of a larger cycle. However, confirmation of that scenario would require LINK to find support at or above the identified zones and begin forming higher highs and higher lows on the chart.
Broadening Wedge Pattern and Breakout Watch
While Elliott Wave theory suggests further downside, the broader chart setup shows a descending broadening wedge. This pattern, visible on the 12-hour chart, typically forms in declining markets and often precedes upward reversals when the upper boundary is broken.
LINK price has recently attempted to breach the upper line of this wedge. The horizontal resistance between $16.50 and $18.50 remains a major test. A breakout above $18.50, especially if confirmed with strong volume, could invalidate the bearish wave (C) scenario and point toward bullish continuation.
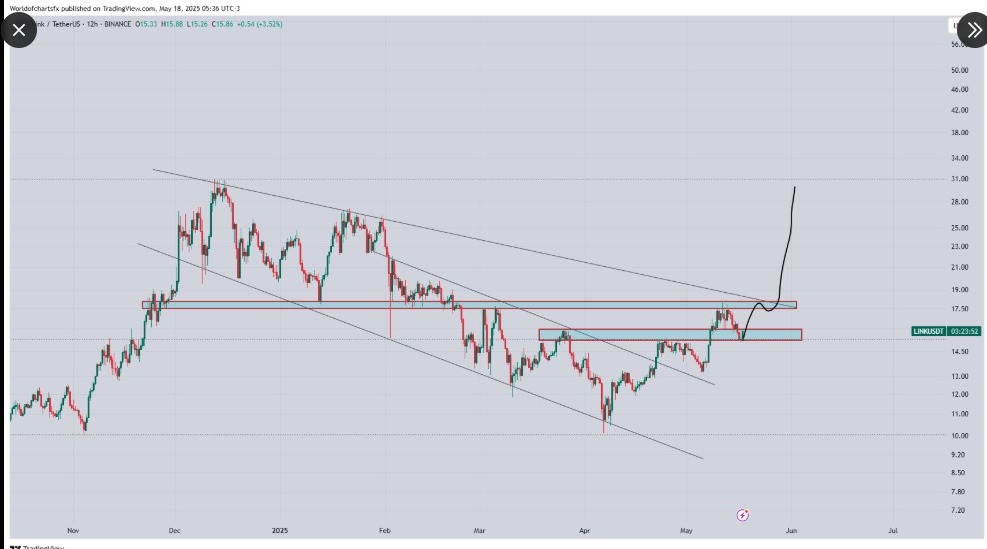
The wedge structure, combined with reduced overhead resistance beyond the $18.50 level, sets the stage for a possible price acceleration. If this occurs, LINK could target levels above $25 and aim toward $30, as illustrated in the projection shared by World Of Charts.
Similarly, the recent LINK price prediction aligns with bullish technical patterns and indicators, supporting potential for a 30% rally if key resistance levels are cleared. The combination of an inverse head and shoulders pattern and a SuperTrend buy signal reinforces the case for upward momentum.
Disclaimer
In this article, the views and opinions stated by the author or any people named are for informational purposes only. And they don’t establish the investment, financial, or any other advice. Trading or investing in cryptocurrency assets comes with a risk of financial loss.




