
 streamoors
 IGNITION
 Sword Inu
 no crying in the casino
 Altai the Tiger
 Pearl
Pearl Pudgy Penguins

Key Insights:
- Binance Coin (BNB) shows steady upward momentum approaching a crucial resistance level near $690.
- Strong support around $618 and a nearly 21% rise in trading volume to about $2 billion indicate growing investor interest and potential for a breakout.
- Technical indicators like the Money Flow Index (MFI) and chart patterns show room for growth. However, a rising wedge pattern suggests monitoring for possible correction risks.
Binance Coin (BNB) seems to be picking up speed as it approaches a resistance point at $690. Over time, higher highs have been each day, suggesting that investors continue to buy.
The movement might result in Binance price hitting new all-time highs. Many alternative coins have been finding it tough lately, making it clearer why BNB stands out now. BNB has shown a strong upward trend on its daily candlestick chart. This rise has been visible since mid-April.
A drawn-out support line at around $540 inclines upward to where the price is now near $680. So far, this trendline has supported prices when they move down, suggesting buyers remain interested
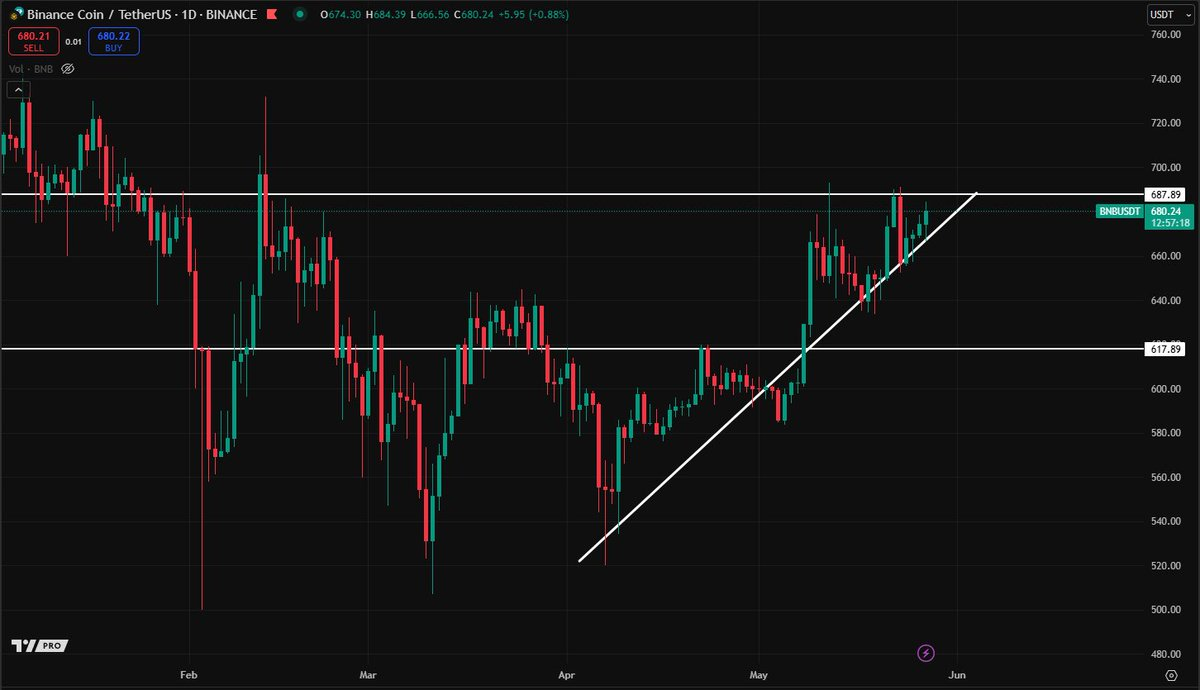
BNB price also has trouble breaking through the area between $687 and $690. In recent days, Binance Coin has consistently closed near the previous resistance. This showed that the coin was gathering strength to break out.
Higher highs and higher lows are a traditional sign of an upward market trend. If the price of BNB moves past $690 with good volume, it may draw new investors and help the upside move.
BNB Price Stabilization and Market Trends
A further BNB price stabilization point appears at $618 due to horizontal support. It has recently upgraded from a line of resistance to one of support, making it more prominent for traders.
Once it surpassed $618 in early May, BNB has been using that level to help continue its rise. Trading volume indicates that the BNB market is getting busier.
CoinMarketCap data shows the trading volume over the past day has increased by nearly 21% to almost $2 Billion. The growing volume means traders are preparing for the resistance zone. This is usually a sign that a breakout could happen shortly.
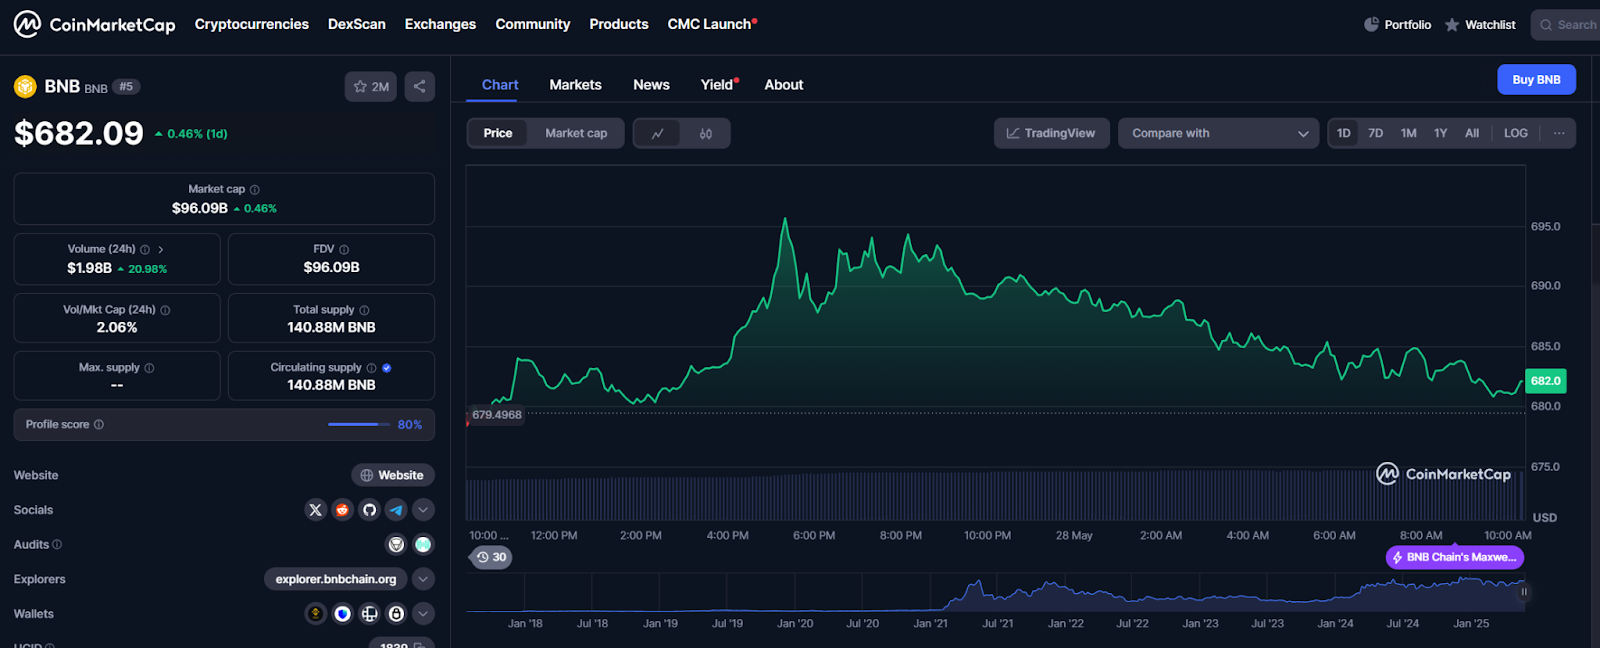
Volume shows us if real investors are involved in the price changes. A sharp increase in both price and the number of coins traded indicates that buyers are genuinely active.
Technical Indicators and Chart Patterns Show a Possible Breakout on BNB
Technical indicators reveal signs that the breakout may happen. The MFI, used to assess buying and selling activity, is now around 52.5.
This area on the chart means prices are neither too high nor too low. So, BNB has space to rise before it reaches levels that typically cause a pullback.
In recent weeks, you can see that a rising wedge chart pattern has formed. When a price is in a rising wedge, momentum often decreases, and there could soon be a reversal.
Prices below the lower trendline on the wedge could mean the market is easing toward a downturn. BNB recently broke out of a bullish pattern.
It remains above the support level, keeping the uptrend intact. BNB price movement suggested continued strength in the market.
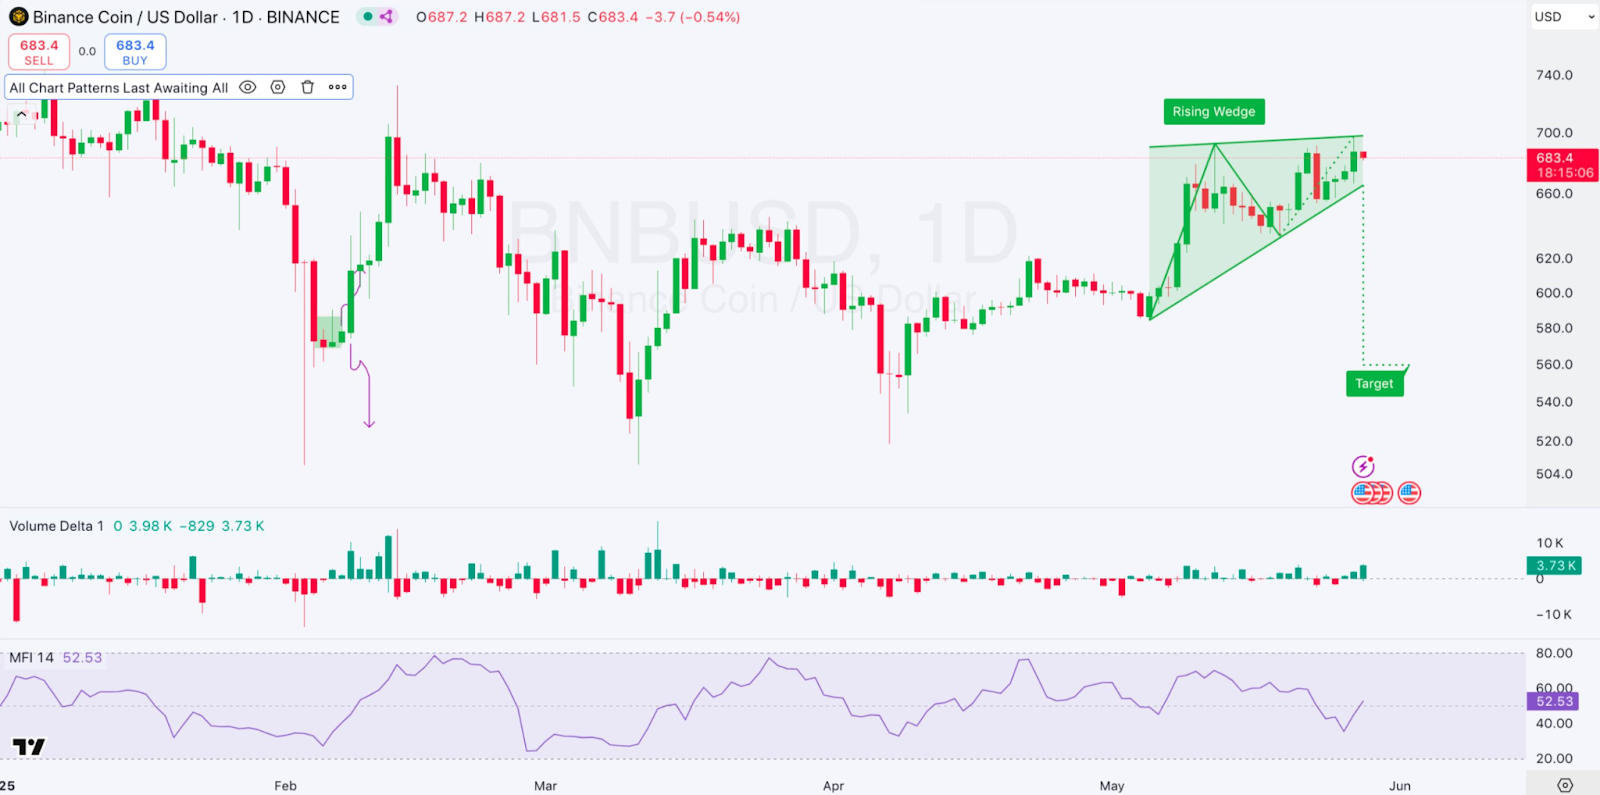
Dropping below the wedge soon could begin a correction. An upside breakout and rising volume would be more critical than the bearish threat from the wedge.
BNB has a market capitalization of about $96.1 Billion today, a slight rise of 0.46% from yesterday. All coins are currently in circulation. There are no new tokens yet.
With a fully diluted valuation (FDV), the market’s total value reflects every token that can be created. BNB’s rising market cap and volume show that genuine buyers are interested.
While BNB is almost ready to break out, most other altcoins have slowed their growth. The gap between BNB and the rest of the market proves its robustness during tough market periods.
Under these circumstances, the market may favor BNB because it has a secure place and in-depth technical strength. Breaching $690 with success would be a significant technical success for the BNB cryptocurrency.
In the past, surpassing critical resistance levels usually meant that the price of an asset went up rapidly. Should BNB price surpass this level, it may aim to revisit its old all-time high at $700.
Disclaimer
This article is for informational purposes only and provides no financial, investment, or other advice. The author or any people mentioned in this article are not responsible for any financial loss that may occur from investing in or trading. Please do your research before making any financial decisions.




