
 streamoors
 IGNITION
 Celestia
 Injective
 Starknet
 Pearl
Pearl Quantus

Key Insights:
- SUI crypto surpasses $45 billion in volume, reflecting strong market growth.
- SUI’s 19.22% increase in volume over 30 days is impressive.
- A falling wedge pattern suggests a potential bullish breakout, targeting $4.50 price.
SUI crypto recently exceeded a total aggregator volume of over $45 billion. This represents a good headway of 19.22% in the last 30 days.
SUI Crypto’s Aggregator Volume Surpass $45 Billion
As of June 19, 2025, SUI’s Aggregator volume was 45,722,501,477 dollars. It also had an average volume per month of 2,540,138,970 dollars. This surge in the volume shows the rising interest in SUI and the rise in the level of market activity.
By examining this data, we notice that the trend has reached a new high level and has been held that way during several months. This is at least, since the end of 2024. The chart indicates the steady increase in the amount of trading conducted on the monthly basis.
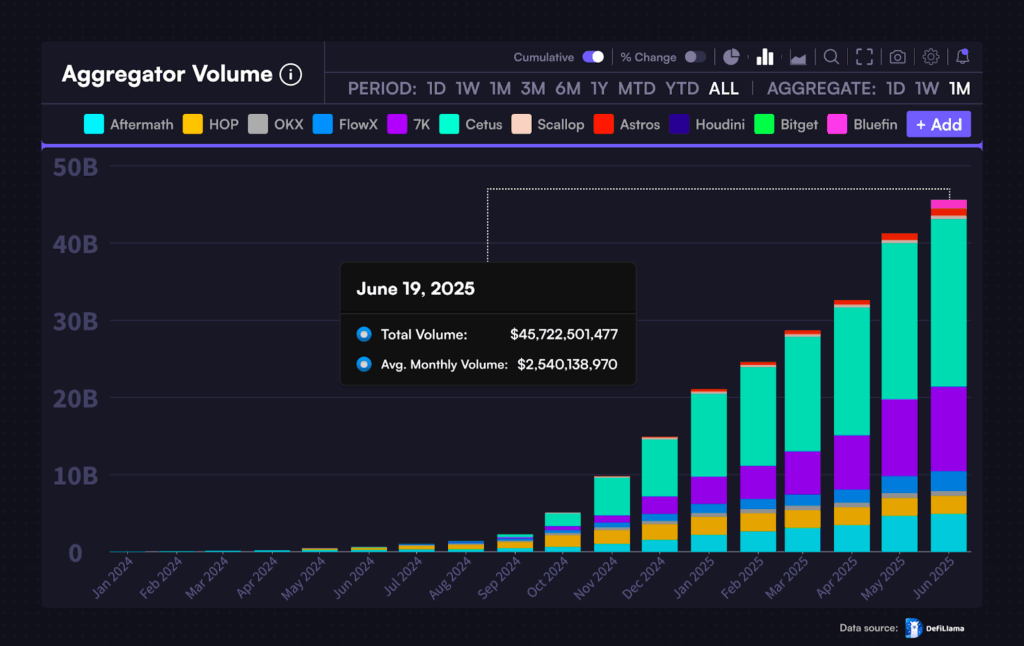
There is a constant increase in the level since the beginning of 2024 until June 2025. This proves that the acceleration of total volume is not an ephemeral factor but a tendency that has lasted several months. The chart shows that the increase is the result of many projects and the sources of liquidity. With the significant role played by big aggregator platforms such as Aftermath, FlowX, and so on. The use of these platforms has considerably boosted the volume through the ease of trade and greater integration of the market.
During the last one-month period, SUI, which recently rallied on ETF applications, has registered a gain of 19.22 in its volume indicating that the investor sentiment is highly bullish. Such a percentage growth demonstrates the rapid development of the token regardless of the possible changes on the market.
Sui Crypto Technical Analysis
Sui charts show the formation of a falling wedge pattern has occurred and this is generally believed to be an indication of a bullish reversal. The falling wedge has a price range that becomes smaller as it goes down and it is defined as an area between two trendlines that meet each other. It shows that volatility is slowly declining. Such a pattern can be considered a precursor of an upside breakout when the price breaks out of the wedge boundaries.
The falling wedge in the case of SUI implies that the token is in a consolidating trend before the possible break. Provided the trend continues, the potential price target of SUI can be the area around the $4.50 mark, which would entail significant growth of the current trading price of the coin, as it is now at an avenue of average price of $2.80.
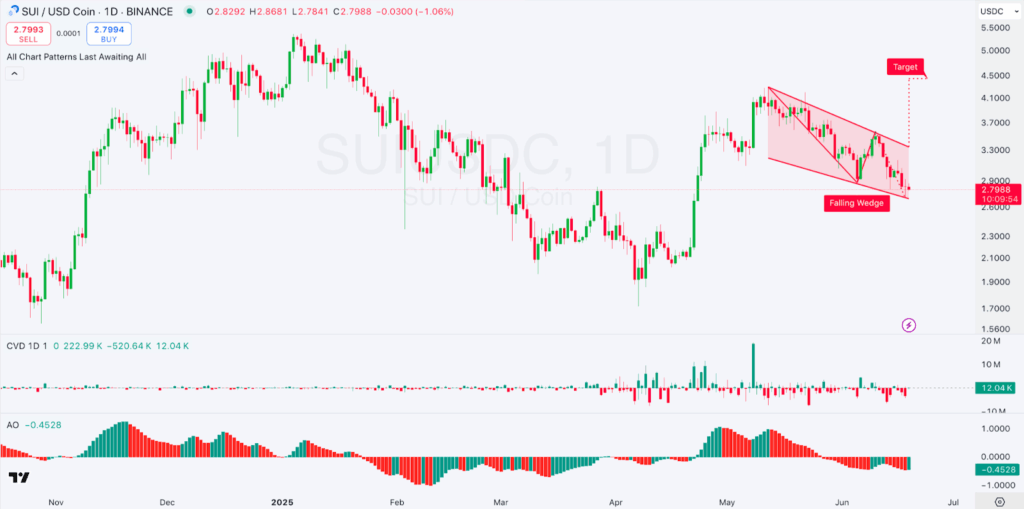
The trend in the Cumulative Volume Delta (CVD) of SUI, recently flipped by Hyperliquid. Is positive and the buying pressure is said to be stronger than the selling pressure. And these are consistent with the price action which is moving up. The fact that the CVD has been increasing implies higher demand and securities in SUI. In the meantime, the Awesome Oscillator (AO) is giving a minor bullish divergence. And the amount of green bars is increasing: momentum is gathering.
The two indicators support the opinion that the token can go upward in its bullish trend. Since buyers were increasing in the market.
It is also during the falling wedge ,when there is a low selling pressure as shown by the declining volume during the consolidation phase. This deficit in selling has been a sign that the bears are losing their grip. And the bulls are slowly finding their bearings and once the price breaks. Above the upper trendline, the price may explode.
Disclaimer
This article is for informational purposes only and provides no financial, investment, or other advice. The author or any people mentioned in this article are not responsible for any financial loss. That may occur from investing in or trading. Please do your research before making any financial decisions.




