
 Altai the Tiger
 IGNITION
 streamoors
 Sword Inu
 NEAR Protocol
 Injective
 Quantus

Key Insights:
- Dogecoin forms ascending triangle; breakout above $0.17 could trigger rally toward $0.20.
- Long positions surge, signaling bullish sentiment and potential short squeeze-driven price spike.
- Stochastic RSI rebound and rising volume suggest growing momentum for upside breakout.
Dogecoin (DOGE) tests key resistance near $0.17, hinting at a potential breakout. Bullish momentum is building as traders watch this level closely.
The technical analysis shows that DOGE has experienced the ascending triangle pattern. The pattern is a constructive chart formation that usually predicts a significant upward move.
Dogecoin Forms Ascending Triangle
Dogecoin hourly charts show a strong ascending triangle formation. This pattern usually appears when an asset records increased lows but fails to overcome a specific resistance level. The upper boundary near $0.17 has been tested multiple times.
Despite this, it remains unbroken. The downward trendline is angled upward, showing growing buyer strength. Each retest pushes the price higher, signaling bullish pressure.
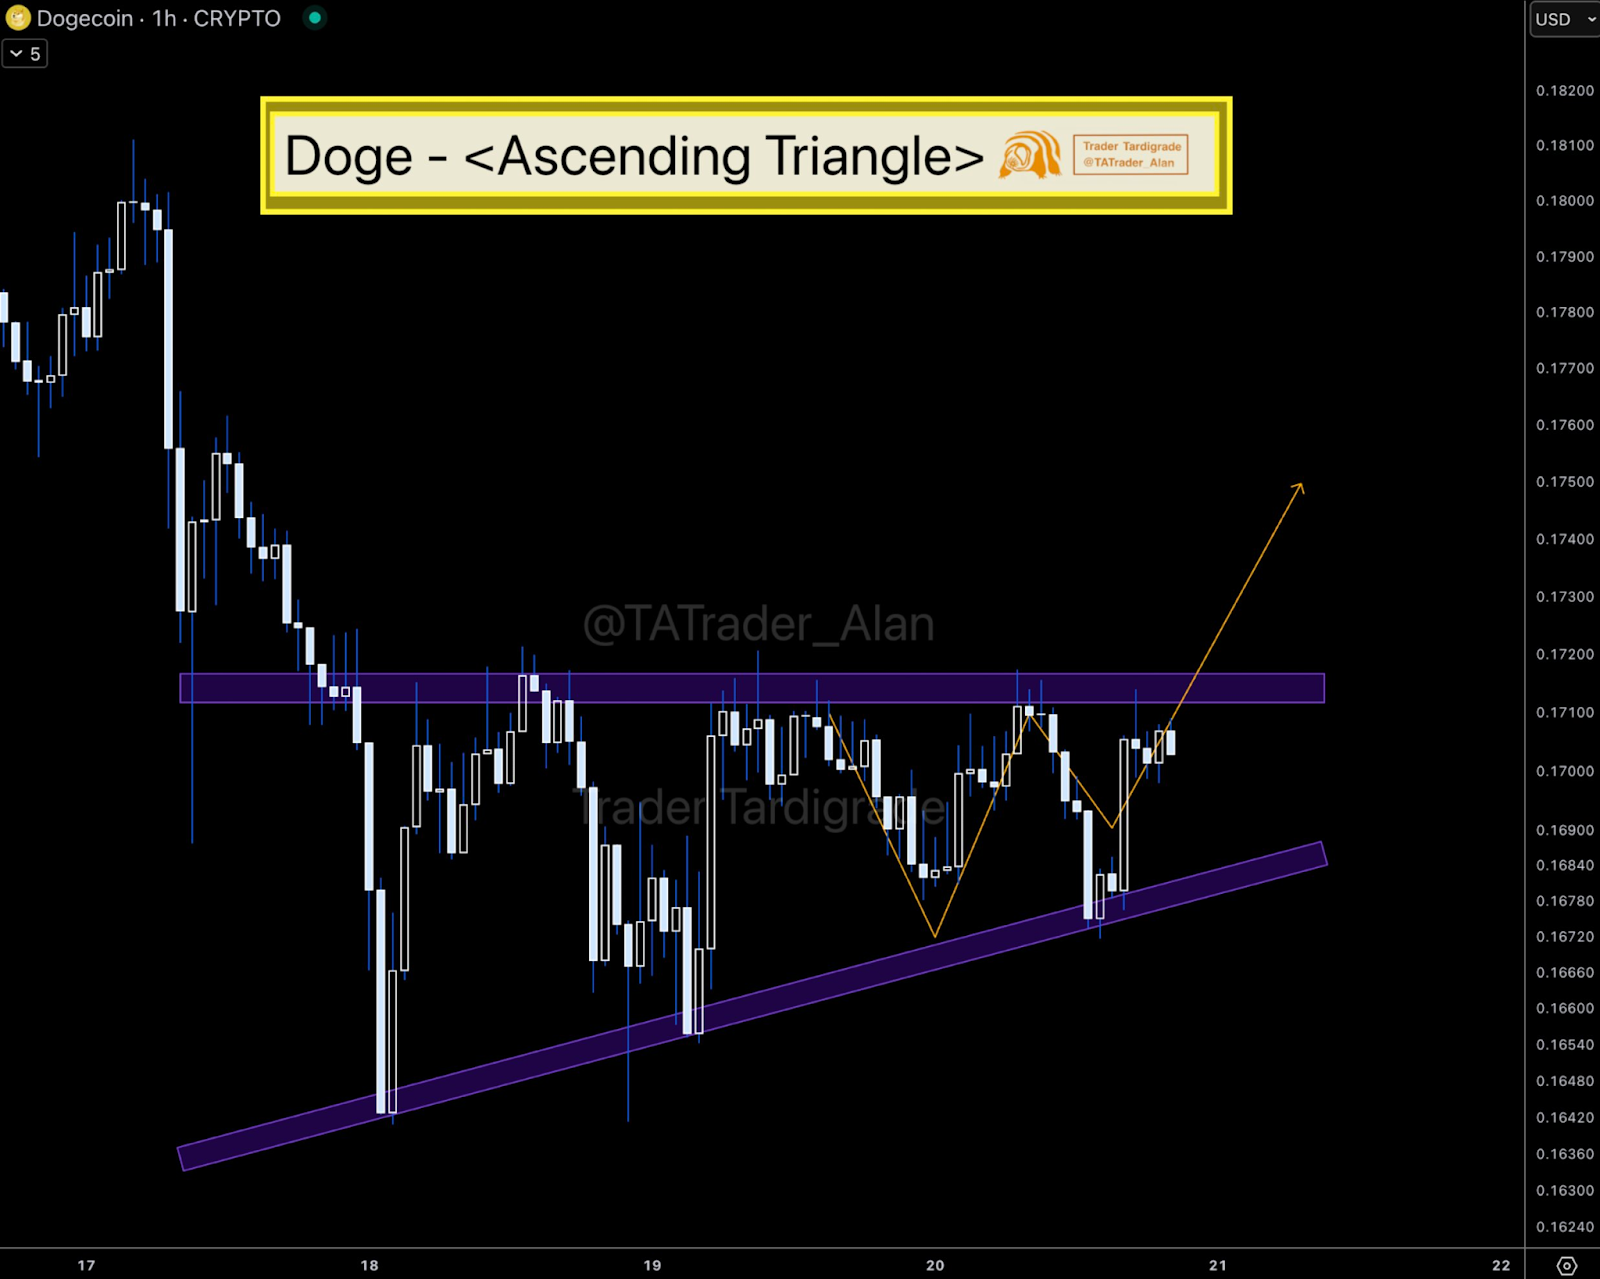
Such a structure is essential since the ascending triangles are typical when the strong breakouts are likely to occur. DOGE is predicted to hit $1.275 in the next altseason.
Dogecoin is trading near the top of its triangle pattern. A strong pullback at the moving average intersection could trigger a breakout. When the price exceeds the $0.17 resistance point, it would indicate a significant rally.
Liquidations Surge as Bullish Sentiment Grows
The most eminent part of the recent DOGE price action is the surge of long positions. The liquidations chart indicates an increasing number of long trades because the market is increasingly bullish.
Such a spike in longs will always happen when traders anticipate further moves on the upside. Large liquidations are also crucial since they may give additional upward movement. Long positions could fuel a rally if Dogecoin breaks above the $0.17 resistance.
A short squeeze may force traders to buy back, increasing the price. This could cause a ripple effect, raising prices, as seen with Solana recently.
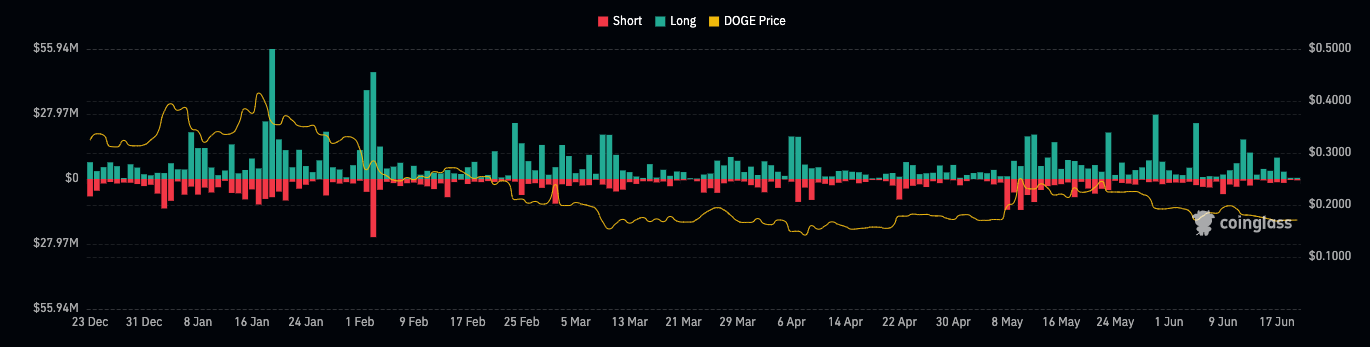
Compared to the bullish long positions, short liquidations have remained relatively quiet. This further enhances the feeling that the market is gearing itself to a possible breakout to the upside.
The figures reveal that the value of Dogecoin has remained above its levels of support. This indicated that the present upward trend is gaining momentum. It is predicted to hit $1 in the long term,
The resistance price of $0.17 is very close, and many traders look forward to a breakout. The current price stands just below the said resistance level. Technical indicators suggest Dogecoin has room to rise further. A key resistance lies at the $0.17 level.
This mark aligns with the top of an ascending triangle pattern. A breakout above it could trigger a strong upward move. The next resistance is expected near $0.18. After that, DOGE may test the $0.20 level.
Dogecoin Technical Analysis and Market Outlook
Dogecoin charts reveal a falling wedge pattern. The pattern is a typical bullish signal following a downtrend. The price is consolidating within converging trendlines, indicating that a breakout to the upside could be imminent.
DOGE is approaching the apex of its wedge pattern. A breakout above the upper boundary could trigger a price surge. This move likely signals a bullish reversal. Price targets are set near $0.18 to $0.20.
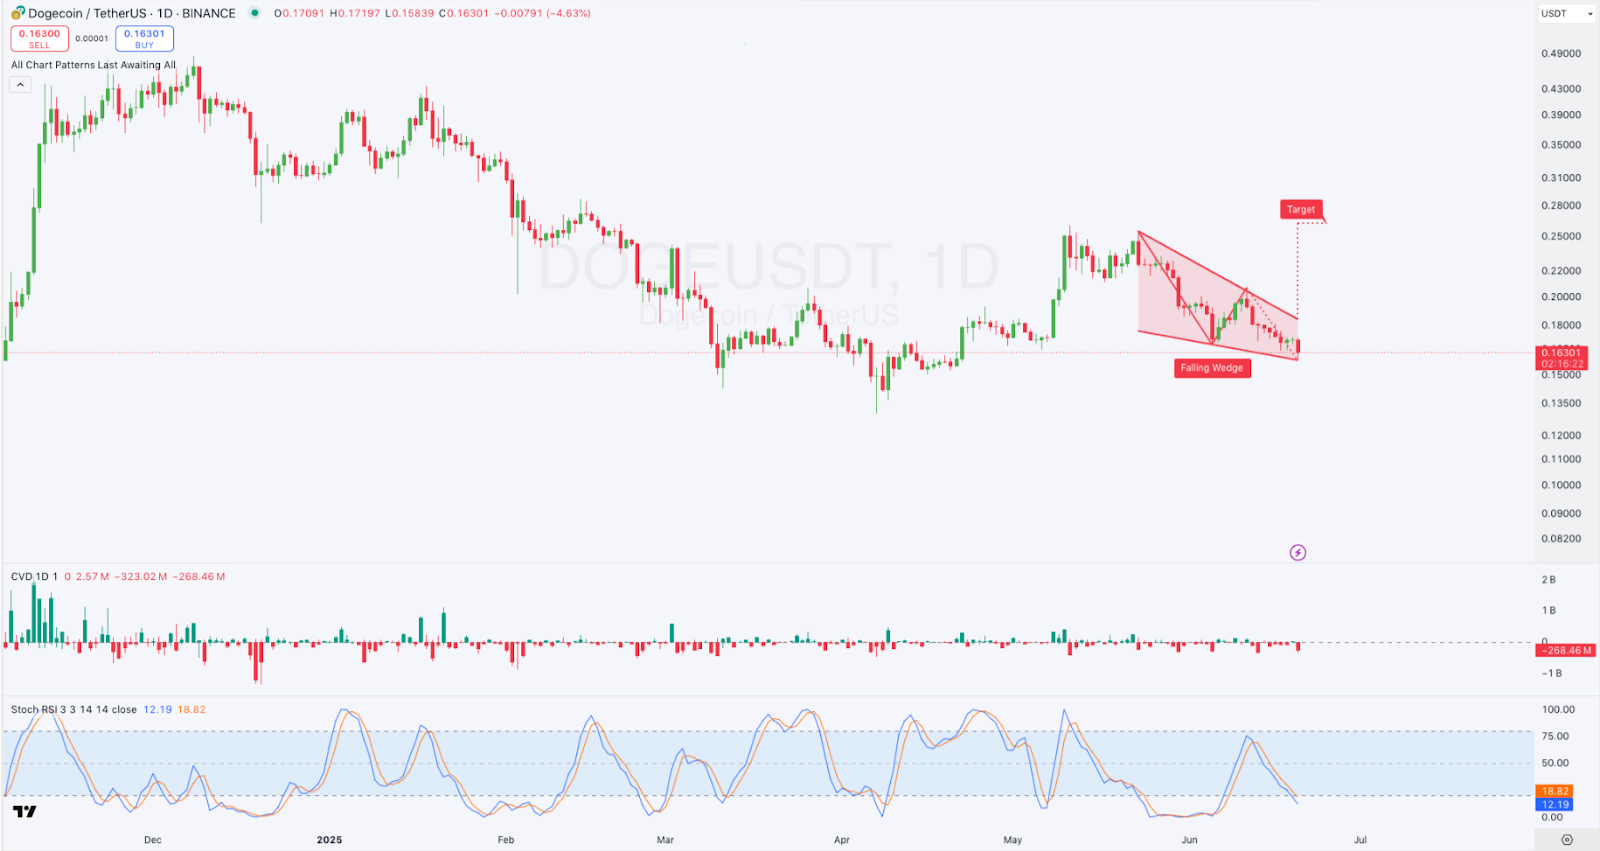
Looking at the volume delta, we see that rising volume could suggest a breakout as Dogecoin approaches the wedge’s apex. Substantial buying volume would enhance the likelihood of a sustained upward move if the breakout is supported.
The Stochastic RSI is currently in oversold territory but is showing signs of moving upward. This shift suggests increasing bullish momentum.
It aligns with the possibility of a breakout from the falling wedge. As the Stochastic RSI rises, selling pressure is subsiding, which supports a price increase.
Disclaimer
This article is for informational purposes only and provides no financial, investment, or other advice. The author or any people mentioned in this article are not responsible for any financial loss that may occur from investing in or trading. Please do your research before making any financial decisions.




