Injective
 Celestia
 streamoors
 Sui
Sui Pudgy Penguins
 Bitcoin
 Pearl
Pearl

Key Insights:
- Solana price hovers at $134 as it tests critical $126 support; a breakdown may trigger a 30% drop to $85.
- Solana stablecoin market cap fell $2.5B in 7 weeks, signaling reduced network activity and token demand.
- $13.14M in long liquidations in 24h highlights weak bullish conviction as traders face rising downside pressure.
Solana price shows early warning signs as traders react to a key technical breakdown. The $126 level has acted as major support over the past two months and is now under intense pressure.
Market analysts observe a rounding top pattern as the price trades around $134.19 on June 23. If this level fails, projections show a potential drop of up to 30%. This could send the Solana price below the $100 mark.
Decrease in Network Activity Supports Bearish Solana Price Outlook
Blockchain data also shows weakening activity across the Solana ecosystem, reinforcing the technical signals. According to DeFiLlama, the total market cap of stablecoins on Solana has fallen sharply in the past seven weeks.
It declined from $13.13 Billion to $10.63 Billion. This represents a $2.5 billion reduction in network liquidity. At the same time, the number of decentralized finance (DeFi) users on Solana has declined sharply.
The total dropped from about 6 million on June 2 to under 3 million at the time of writing. A falling user base reduces the demand for SOL tokens. These are used to pay transaction fees and interact with DeFi protocols.
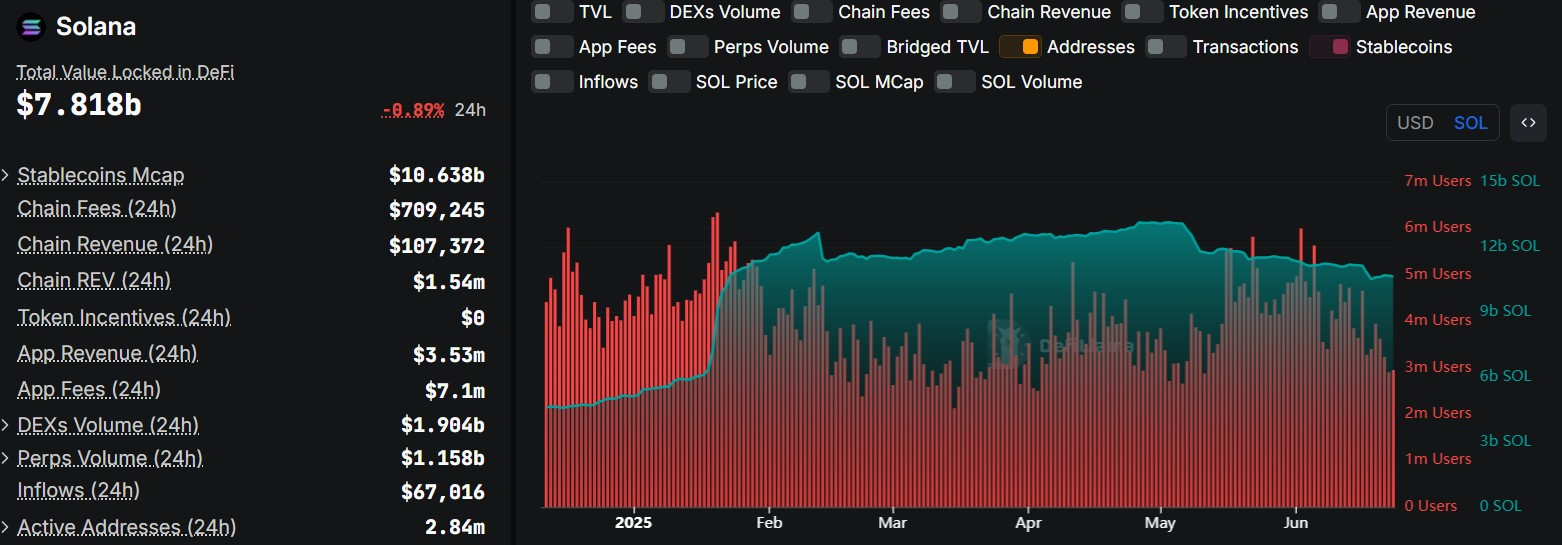
This decrease in network usage adds pressure to the Solana price. Lower on-chain activity often leads to lower transaction volumes, which can cause a reduction in token demand.
If this trend continues, Solana may struggle to regain previous support zones or move back toward the $187 high.
Solana Price Faces Bearish Sentiment from Futures and Options Traders
Recent data from the derivatives market supports the cautious outlook for the Solana price. Futures trading volume currently stands at $15.82 billion, with a minor decline of 0.34%.
This flat activity suggests traders are waiting for confirmation of direction — either a breakout or a breakdown from current levels. Open interest in Solana futures has increased to $5.91 billion, up 2.28%. This rise signals that traders are opening more positions.
However, since volume remains flat, it could mean those positions are speculative or directional, potentially preparing for a breakdown. A drop below $126 may trigger those positions to act, especially on the short side.
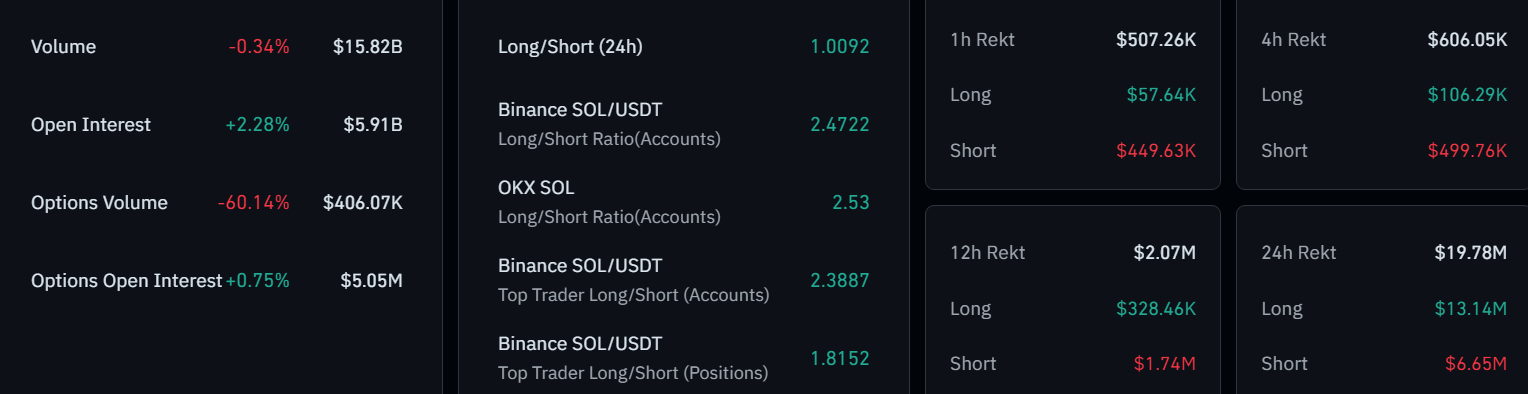
The long/short ratio across the market is neutral at 1.0092. However, data from exchanges like Binance and OKX show more long positions.
Top trader account ratios exceed 2.3 on both platforms, showing more participants are betting on a price rise. This positioning could backfire if the Solana price falls, causing many long positions to be liquidated.
Solana Price Drops as Rounding Top Pattern Gains Traction
According to TradingView, the Solana price is flashing a bearish reversal signal. Also, a rounded top pattern is forming on the daily chart. This structure was initiated in the middle of April 2025 and reached its highest point of approximately $188.17 in the latter part of May. It is currently bending downwards.
The most crucial neckline support is at $126.00. A definite breakthrough beneath this area might initiate a setback to the level of $84.97. This will mean a possible fall of 32.92 percent.
Solana is trading near $134.07 but hasn’t broken above the $135 mark. This level has acted as resistance, forming lower highs.
Trading volume has declined, suggesting market distribution. The technical outlook shows bearish momentum. The MACD line at -6.40 remains below the signal line at -4.61.
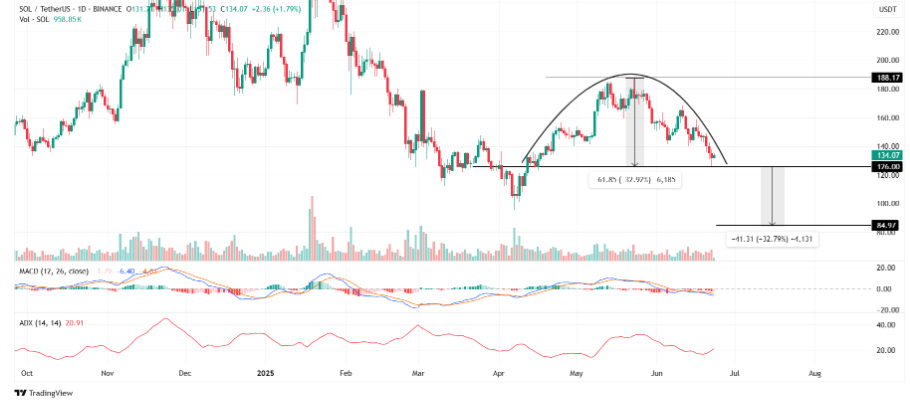
ADX (Average Directional Index) is 20.91, indicating a developing trend with little strength. However, if the ADX rises to more than 25, it would show the increasing strength of the downtrend.
A volume-based decline below $126 can confirm the pattern, and a rebound can postpone the downside move.
Disclaimer
This article is for informational purposes only and provides no financial, investment, or other advice. The author or any people mentioned in this article are not responsible for any financial loss that may occur from investing in or trading. Please do your research before making any financial decisions.