
 no crying in the casino
 IGNITION
 Hood Sword Inu
 streamoors
 Altai the Tiger
 Sword Inu
 Pearl
Pearl

Key Insight:
- Chainlink price reclaimed support at $13.08 with a potential upside target of $15.34.
- Exchange-held LINK dropped to 208M from 212M, indicating reduced sell-side pressure.
- Aktionariat integrated CCIP, signaling Chainlink’s expanding enterprise adoption.
Chainlink price moved in a narrower range at around $13.08 with a solid support level at $12.50, on July 2. Notably, investors observed increasing consolidation pressure under a descending trendline. Despite low momentum, bullish indicators on higher time frames hinted at a possible recovery in LINK price.
Chainlink Price Tested Compression Zone
The current Chainlink price setup remained inside a tight consolidation structure just below a descending red trendline. According to CryptoWZRD, the $12.50 level acted as daily support while the intraday action teased $12.85. The chart showed a series of higher lows forming under resistance, compressing price into a triangle. A confirmed breakout above this structure could open the path toward $16.
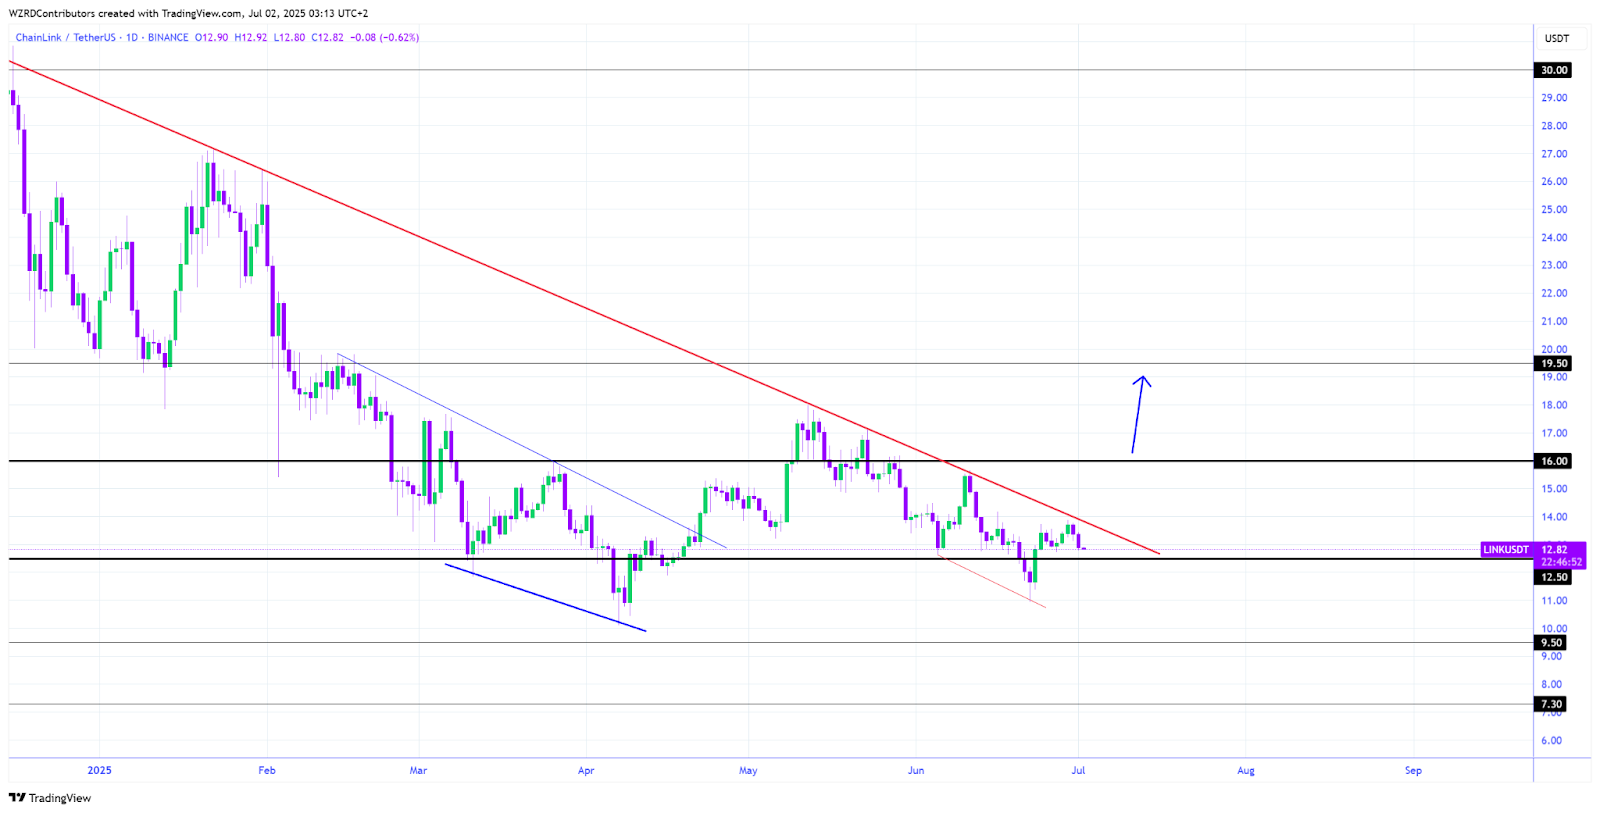
Nevertheless, LINK price was missing a near-term driving force without more convincing upside momentum in Bitcoin. The analysis stressed that LINKBTC also had a slight weakness, and any continued advancement would rely on a stilling of the Bitcoin dominance.
Consequently, this was in line with the market pattern in the previous cycles, where the altcoins could only rally if Bitcoin stabilized or was on a downward trend.
In the meantime, another analyst pointed out that Chainlink price had managed to maintain support, and it could revisit $15.30 in the upcoming sessions.
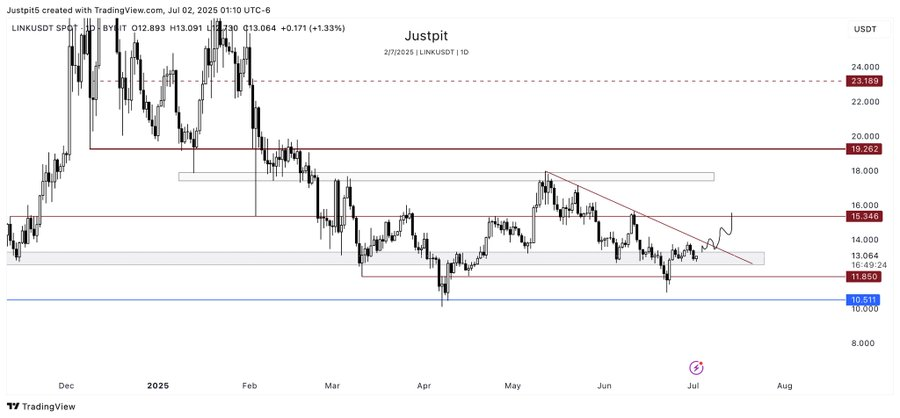
The structure indicated a broken reversal in early June as the bulls were attempting to reclaim the range of $13.60 and $15.30. LINK price may retrace back to this zone and test the bigger resistance band at around $16.
Elliott Wave Signals Added Pressure on Lower Timeframes
Moreover, Man of Bitcoin’s hourly analysis marked the current Chainlink price in a corrective wave-(B) structure, targeting $13.16 to $13.62 as temporary resistance. The previous leg constituted a five-wave decline that had reached close to $12.50 and indicated that LINK price had moved into its corrective retracement process.
The area of resistance coincided with Fibonacci retracement and trendline resistance.
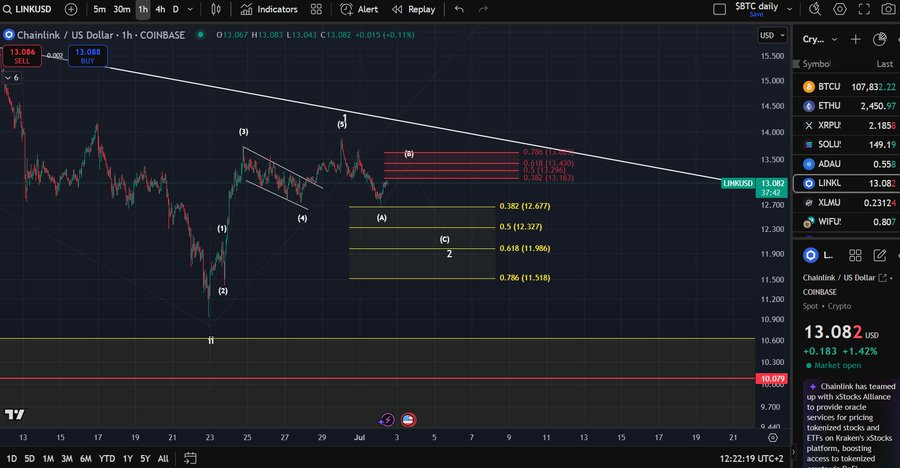
If LINK price gets rejected in this zone, the next wave-(C) could drive it toward lower targets between $12.00 and $11.50. With the 0.5 and 0.618 Fibonacci support lines suggesting possible stabilization at those points, it then reflected on the posited stabilization at 0.73 points.
However, the support at $12.50 would not only prevent further selling and a deeper correction, but would also provide further validation of the ongoing base.
More so, his wave structure was also confirmed on the daily chart with trailing volume during the corrective upswing, which indicates little strength. Prices were oscillating within a very narrow range between $12.80 and $13.60, and a breakout of this zone was very crucial to the short-term trend.
On-Chain Metrics Supported Long-Term Bullish Outlook
Moreover, on-chain data was still positive even amid the short-term compression on LINK holders. According to Santiment data, the overall supply of LINK tokens that were held in exchange declined by 220 million tokens in June to 218 million tokens at the beginning of July. This correction showed less selling activity and long convictions by holders.
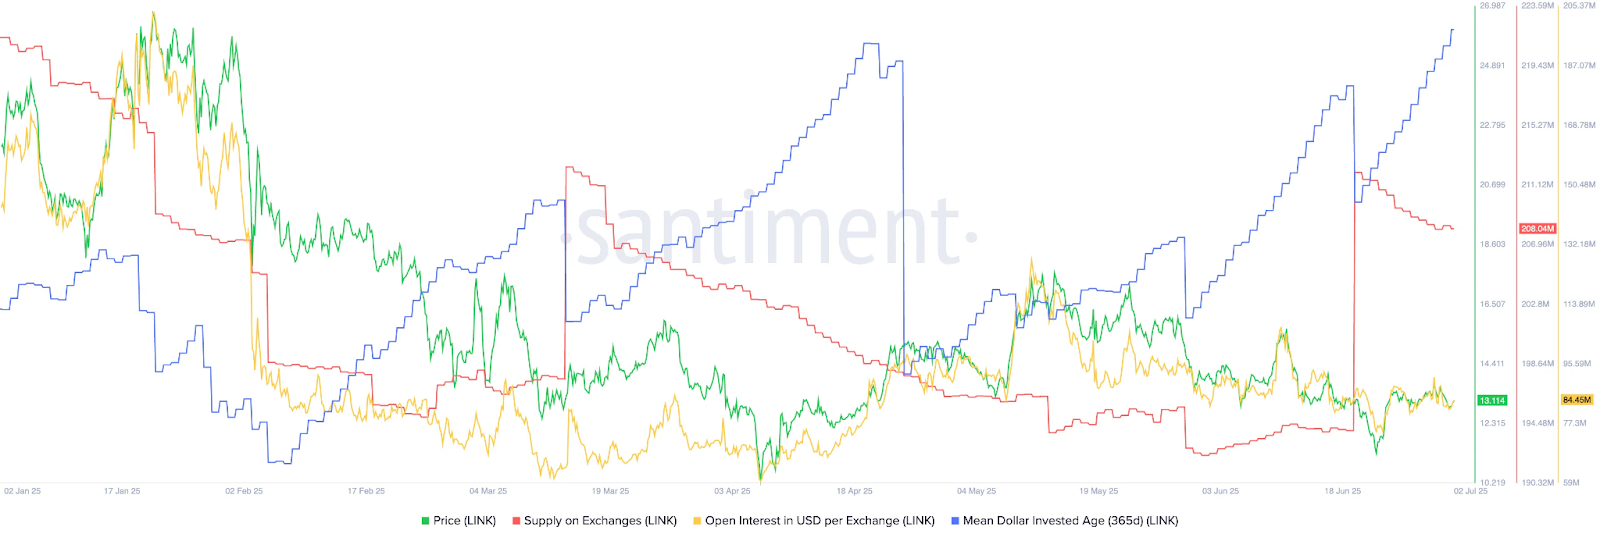
Additionally, the Mean Dollar Invested Age (MDIA), a key accumulation indicator, climbed from 110 in April to 129.50. The increasing MDIA could be an indication that the older coins were staying stagnant, which is usually followed by significant cost increases. In the past, this has coincided with recovery periods after prolonged corrections.
CCIP Expansion Enhanced Chainlink’s Utility
Adding to Chainlink’s macro strength, the project advanced its institutional adoption via CCIP integrations. Aktionariat, a Swiss equity tokenization firm with 30,000+ investors and 70 onboarded companies, integrated Chainlink’s CCIP for cross-chain treasury accounts.
The integration utilized Ethereum, Optimism, and Polygon multi-signature wallets with which to coordinate capital.
This development showcased how Chainlink’s infrastructure served as a core layer in tokenized finance. CCIP introduced the network as such an important service of multi-chain asset operations that businesses on the protocol have an opportunity to handle real assets on the chain. The sustained use of Chainlink’s oracle and messaging services contributed long-term value support to LINK price.
Moreover, there was also macro demand in 2025 for tokenization solutions, especially in Europe and Asia. Chainlink smart contracts would serve the benefits of its ecosystem as the financial sectors shifted towards compliant, cross-chain treasury operations. These tendencies showed there was institutional momentum to LINK price beyond the speculative price action.
Disclaimer
This article is for informational purposes only and provides no financial, investment, or other advice. The author or any people mentioned in this article are not responsible for any financial loss that may occur from investing in or trading. Please do your research before making any financial decisions.




