
 streamoors
 IGNITION
 Injective
 Quantus
 NEAR Protocol
 Pearl
Pearl LayerZero
Key Insights:
- PEPE coin has formed a bearish flag price action pattern on the daily time frame near a key support level.
- Amid market uncertainty, if the PEPE price breaks down from this key support, a 37% price drop could be expected.
- This bearish outlook is further reinforced by intraday traders, who appear to be strongly betting on short positions.
Pepe (PEPE), the popular meme coin, appears to be garnering massive attention from crypto enthusiasts due to its bearish outlook. This negative sentiment emerged during a period when major assets like Bitcoin (BTC), Ethereum (ETH), and others experienced bullish commentary, with their charts flashing strong bullish signals.
Amid this, the PEPE coin price appears to be struggling and has formed a bearish price action pattern on the daily time frame.
PEPE Coin Price Momentum
At press time, the PEPE coin price stands at $0.000009553 and has recorded a modest dip of over 0.85% in the past 24 hours. During this period, investor and trader participation has dropped significantly, leading to a 35% decline in trading volume.
This substantial drop in trading volume, while the price struggles, indicates a lack of interest and confidence from traders and investors in the meme coin.
The potential reason behind this drop and lack of interest from investors and traders is that the sideways price momentum that the PEPE coin has exhibited over the past few days.
PEPE Technical Analysis and Price Action
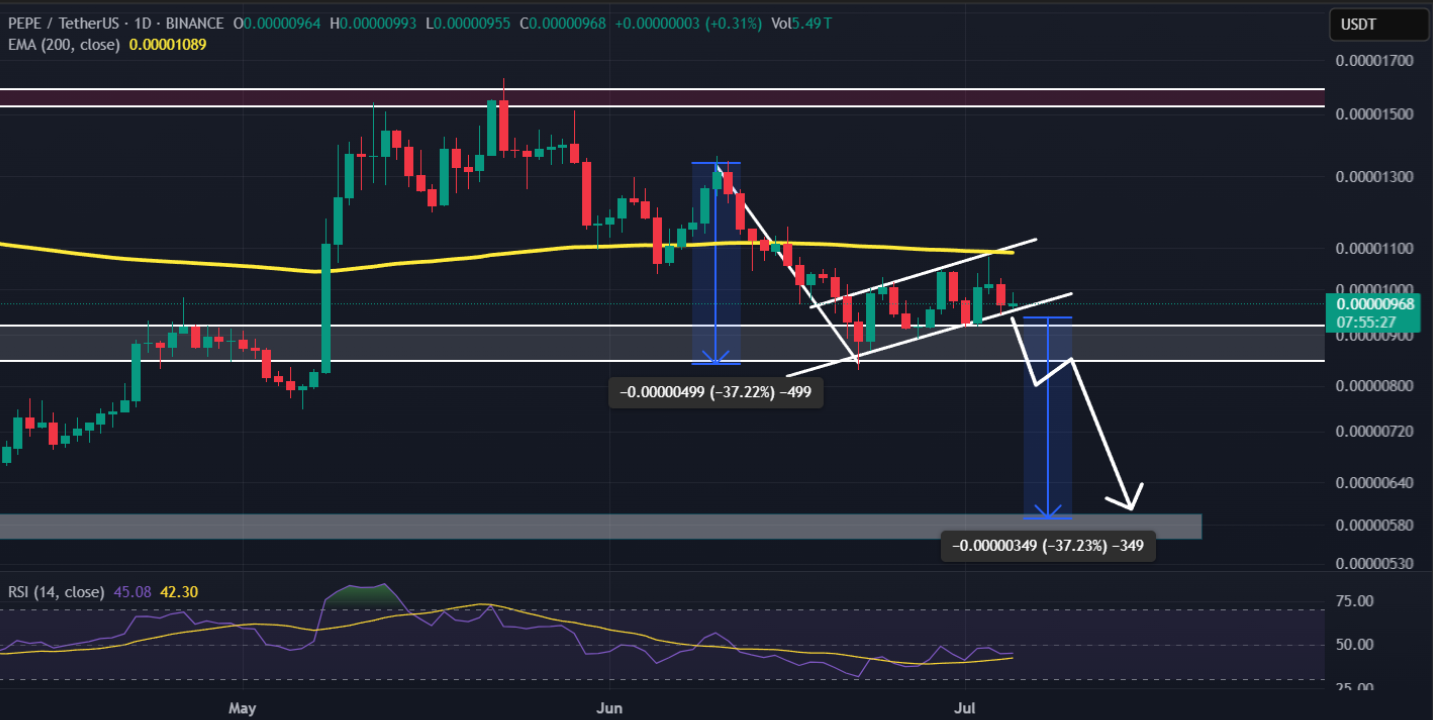
According to expert technical analysis, the PEPE coin appears bearish as it has formed a bearish flag and pole price action pattern on the daily time frame. This pattern has been forming around the key support level of $0.0000090.
The daily chart reveals that the PEPE coin has been respecting this support level for the past two months, and it plays an important role amid ongoing market uncertainty.
Price Prediction of PEPE Coin
Based on the recent price action and historical patterns, if the PEPE coin price continues to struggle and fails to hold this support level, a significant decline can be expected.
The chart reveals that if the meme coin breaks below this key support level and closes a daily candle beneath it, there is a strong possibility that the PEPE coin could drop by 37% in the coming days.
EMA and RSI Insights
At press time, the PEPE coin price is trading below the 50-day Exponential Moving Average (EMA) on the daily time frame, indicating that the meme coin is in a downtrend. Additionally, market sentiment remains bearish, with significant sell-offs observed across major exchanges.
Meanwhile, meme coins’ Relative Strength Index (RSI) stands at 45, indicating a neutral-to-bearish momentum, with the asset showing limited buying pressure and the potential for further downside if support levels fail to hold.
Bearish On-Chain Metrics
Given the current market sentiment, traders appear to be leaning toward the bearish side, as revealed by the on-chain analytics firm Coinglass.
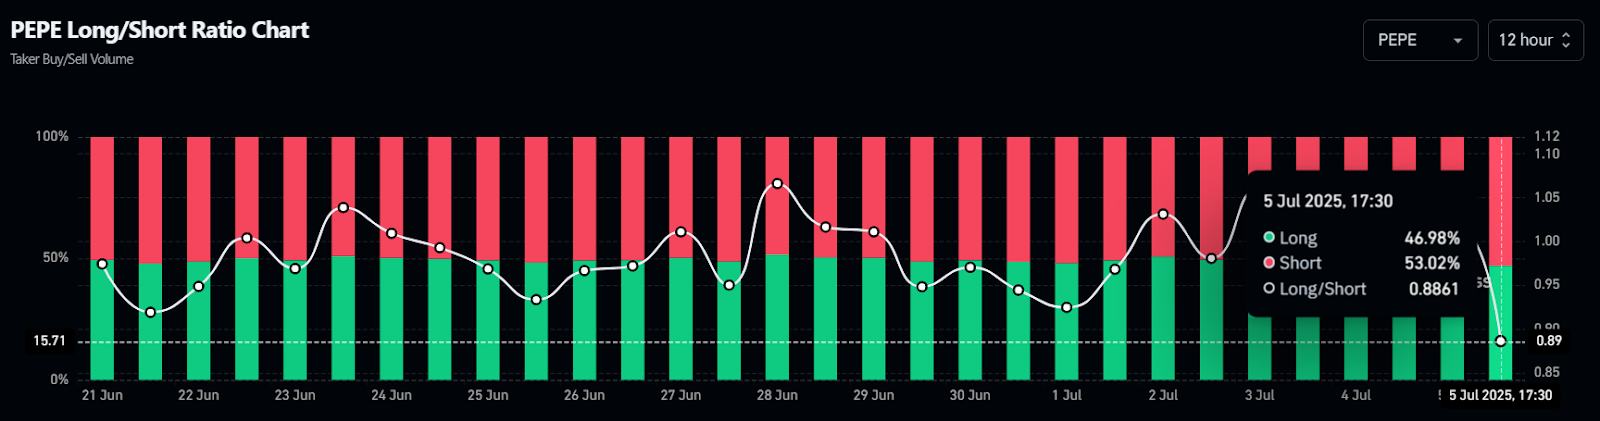
Data reveals that the PEPE long/short ratio currently stands at 0.8861, indicating strong bearish sentiment among traders. This metric further shows that, at press time, 53.02% of top traders appear to be betting on the short side, while 46.98% are on the long side.
Additionally, traders are currently over-leveraged at $0.00000948 on the lower side (support) and $0.00001006 on the upper side (resistance). At these levels, they have built $4.77 million worth of long positions and $6.18 million worth of short positions, clearly indicating a strong bearish signal from traders.
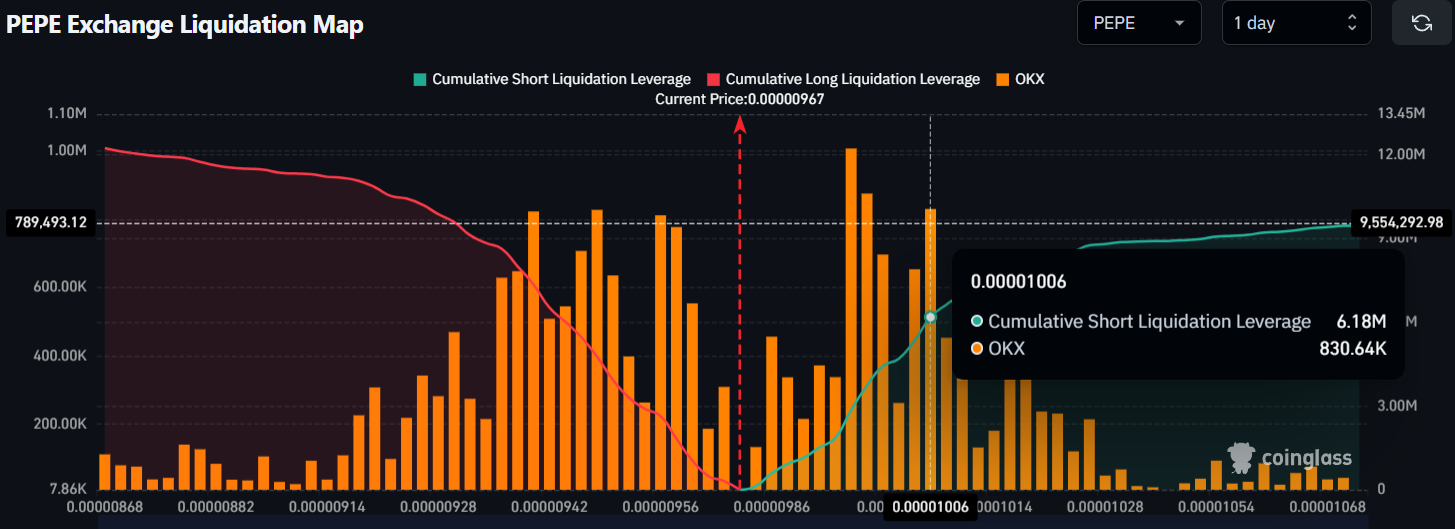
When combining these metrics with the PEPE coin’s price action, it appears that sellers are in control and are pushing the meme coin’s price to lower levels.
Disclaimer
This article is for informational purposes only and provides no financial, investment, or other advice. The author or any people mentioned in this article are not responsible for any financial loss that may occur from investing in or trading. Please do your research before making any financial decisions.




