
 streamoors
 Altai the Tiger
 Sword Inu
 IGNITION
 no crying in the casino
 Quantus
 NEAR Protocol

Dogecoin (DOGE) price has remained range-bound after dropping from a recent high near the $0.23 level. The cryptocurrency currently holds above a key support area around the $0.15 mark. If buyers regain momentum, DOGE could potentially test the $0.20 resistance in the coming sessions.
Dogecoin Price Eyes Rebound if Support Holds
Crypto analyst Ali has highlighted a possible upward move for the Dogecoin price, provided it stays above a key support level at $0.15. According to his recent analysis, the longer DOGE maintains this position, the more likely it is to rebound toward the $0.22 mark.
Ali’s chart shared on X post media, shows a strong ascending trendline supporting Dogecoin’s price action since early 2024.
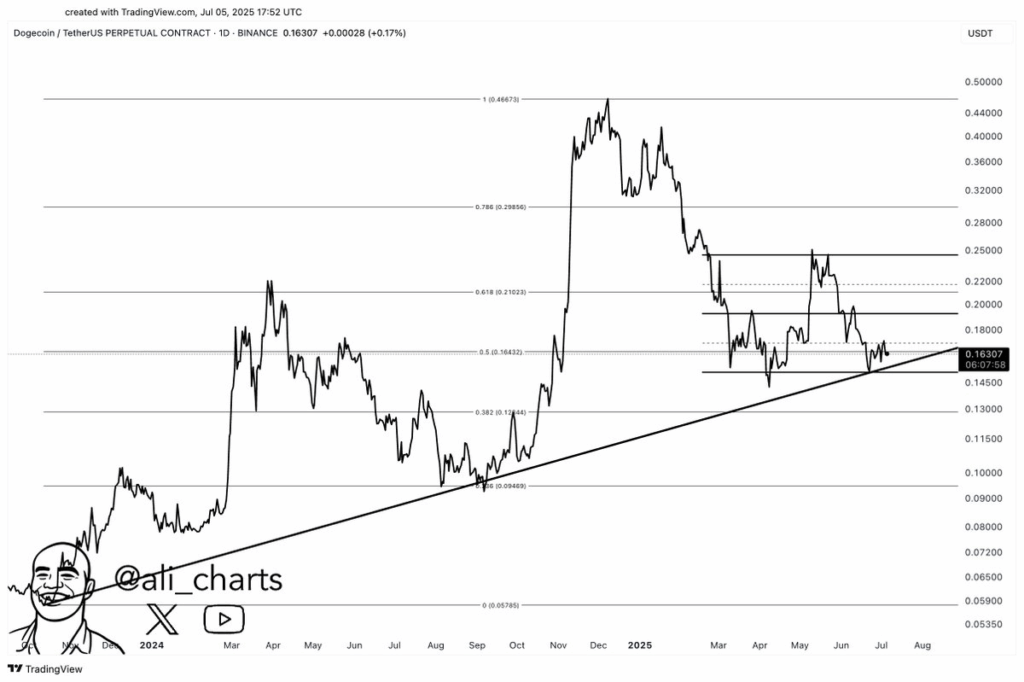
This trendline acts as a foundation for potential bullish momentum if the price continues to respect it. The analysis also outlines multiple resistance levels between $0.15 and $0.22, suggesting DOGE is trading within a key range.
DOGE Price Signals Bullish Reversal on Biweekly Chart
Trader Tardigrade, the analyst on Twitter, has discovered a possible bullish indicator towards Dogecoin on the biweekly timeframe. As per his recent work, the meme-derived cryptocurrency has developed a Stochastic bullish crossover in the oversold section.
This technical indicator usually provides a possible change in the momentum, leaving a possibility of an upward trend. Another aspect demonstrated in the chart is the steady support that Dogecoin has enjoyed along a long-term up-sloping trendline maintained throughout, for more than 1 year and 6 months.
The visual illustrates that price action has been bouncing off this upward trendline repetitively and thus adds to its importance. This structure has been adhered to by Dogecoin in the last 623 days, implying great long-term support.
At the bottom of the graph, the stochastic oscillator also gives an upward indication that a crossover has in the past led to price rallies. This setup and the support of the trendline have attracted the attention of the technical analysts.
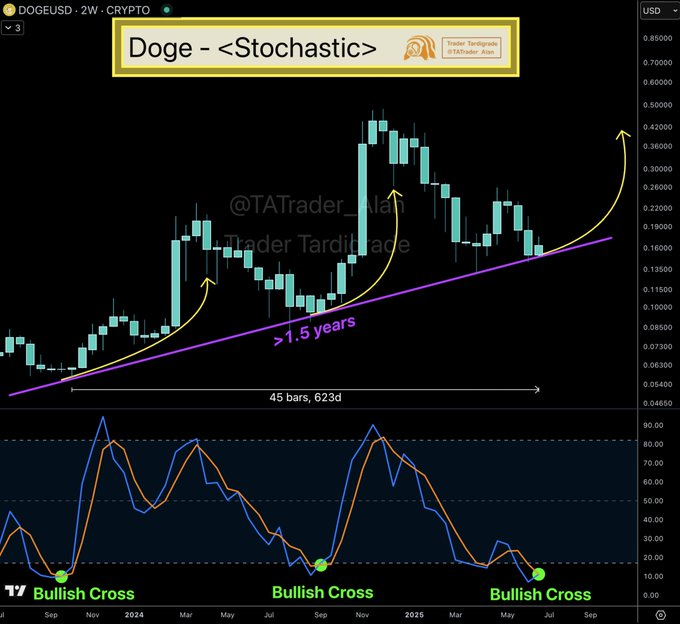
The market analyst has suggested that Dogecoin price could be ready to break out massively. The recent price action indicates the cryptocurrency moving off the strong support level and heading to a critical downtrend resistance.
The bullish breakout of this resistance might result in a very bullish bounce of the price, as in the past, steep upward trends on the chart. A close display of the visual analysis reveals a strong trending line of resistance, and an expected breakout pathway that is expected to exhibit a high acceleration of price.
Can Dogecoin Price Break the $0.17 Resistance?
When writing, the DOGE price trades at $0.1690, reflecting a modest 2% surge in the last 4 hours.
The 4-hour chart shows that DOGE has attempted to break above the $0.17 resistance level. However, sellers are currently holding their ground at that zone. A successful close above $0.17 could open the door for a rally toward the next key resistance at $0.18.
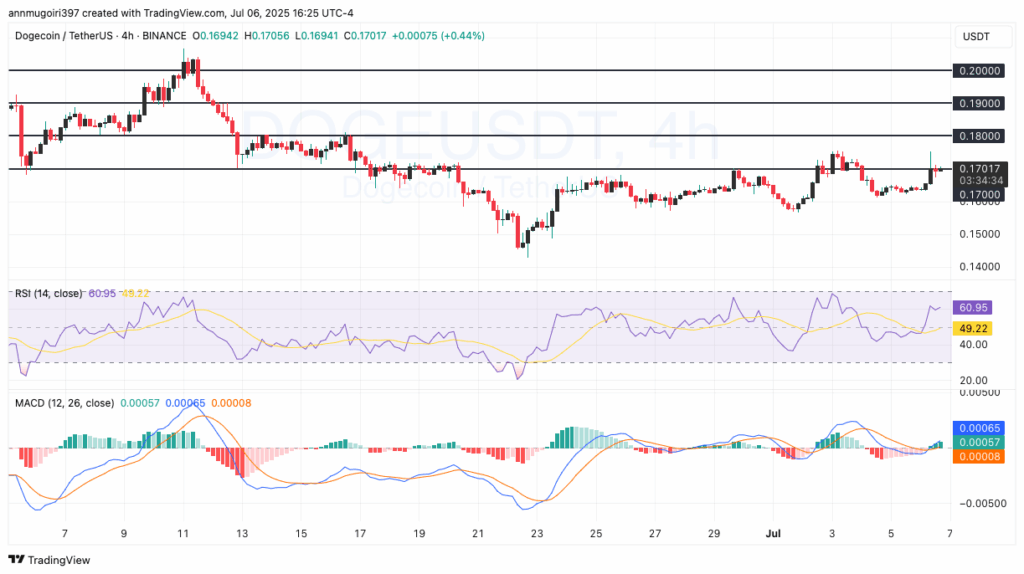
If bullish momentum continues beyond $0.18, the next targets would be $0.19 and potentially $0.20 in the short term. These levels align with previous price action and could act as strong resistance if tested again.
On the downside, the $0.16 area remains a strong support zone. A breakdown below this level may trigger a decline toward $0.15.
The relative strength index (RSI) is at 58.41, indicating an increase in bullish pressure but not yet overbought. This means that there is some excess margins that a buyer can bring the price up without immediate counteraction.
There is a slight bullish crossover on the MACD indicator. The MACD line crossed into the positions above the signal line, which indicates that a trend may continue.




