
 Sword Inu
 streamoors
 Altai the Tiger
 no crying in the casino
 IGNITION
 Pudgy Penguins
 Quantus
Key Insights:
- With recent tariff tensions, Chainlink (LINK) traders have turned bearish, as revealed by Coinglass data.
- The bearish outlook among traders emerges as LINK approaches a key resistance level that has historically triggered price drops.
- LINK’s large transaction volume, typically associated with whales and institutions, has dropped by 28%, further strengthening the bearish outlook.
Chainlink price appears to be retesting a key resistance level for the fourth time in the past two months. Given the bearish market outlook, recent tariff tensions, and historical patterns, LINK is on the verge of a price crash.
Chainlink Price Faces Pressure Amid Rising Global Tariff Tensions
On July 7, 2025, United States President Donald Trump imposed a 25% tariff on Japan and a 25% tariff on South Korea.
Trump further stated that he would raise tariffs on Japan if they retaliate by increasing tariffs on the U.S. In addition to South Korea and Japan, the U.S. has imposed a 30% tariff on countries like South Africa.
Trade tensions are currently weighing down the crypto market. Chainlink price is particularly vulnerable, given its past tendency for sharp reversals. Since May 2025, the asset has reached this descending trendline resistance multiple times.
Each time, it has recorded a price dip. The daily chart reveals that this is the fourth time the asset is approaching this level. Also, experts speculate that history may repeat itself.
Chainlink Price and Fall of Trading Volume
At press time, Chainlink price stood at $13.47, recording a 0.40% dip in the past 24 hours. Given the current market sentiment and ongoing tariff tensions, investor and trader participation has fallen sharply.
LINK’s 24-hour trading volume has decreased by 16%, according to CoinMarketCap. This marks a noticeable dip compared to the previous day.
This decline in trading volume suggests a lack of investor and trader confidence in the asset. Additionally, historical patterns and trade wars are the main concerns behind this drop.
Meanwhile, large trading volume, typically linked to whales and institutional investors, has dropped by 28% during the same period.

Both small and large investors are abandoning the LINK token. This could negatively impact the asset’s price.
Traders Turn Bearish, Short Positions Dominate
Traders are shifting their positions toward a bearish outlook, according to Coinglass. Over-leveraging is evident near the $12.99 support level.
Strong interest is also concentrated around $13.83 on the upper side. These levels suggest heightened activity and market tension.
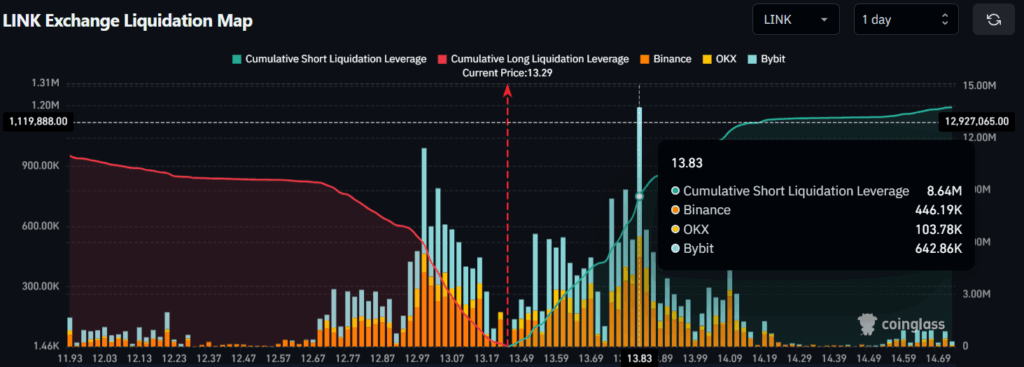
On-chain data shows traders have opened $5.87 Million in long positions. Short positions are higher, totaling $8.64 Million. These metrics indicate strong bearish sentiment and suggest a potential price drop.
In addition, LINK’s long/short ratio currently stands at 0.935. This indicates a strong bearish sentiment among traders about the Chainlink price.
The metric further reveals that 48.32% of traders across the crypto space are betting on long positions. On the other hand, 51.68% are positioned short.
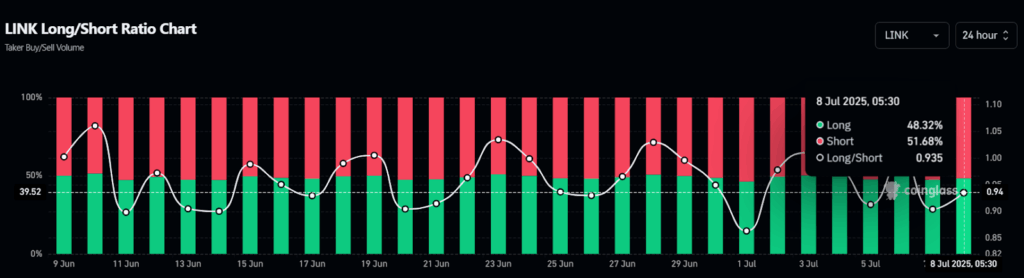
Market sentiment and tariff tensions are fueling bearish pressure. This dominance could influence the Chainlink price trajectory in the near term.
Chainlink Price Action and Key Technical Levels
According to expert technical analysis, Chainlink price is near a key resistance level, formed by a descending trendline. Historically, this is the fourth time LINK has approached this trendline. However, the asset recorded a price drop during the last three consecutive attempts.
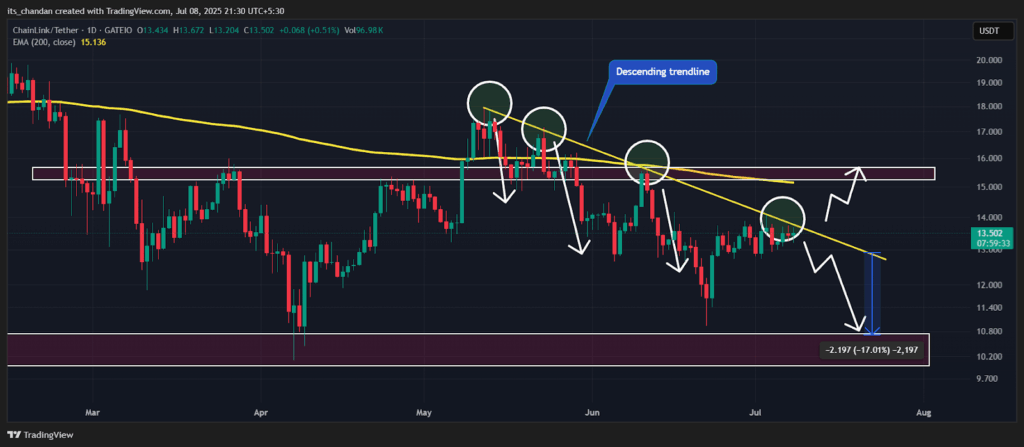
Chainlink’s recent price movement shows difficulty breaking above the trendline. If this persists, the price could drop again, repeating past patterns.
However, this downtrend could end only if LINK closes a daily candle above the $13.80 level. If this happens, the prolonged bearish trend will likely end, and the asset could see a strong upside rally.
Disclaimer
This article is for informational purposes only and provides no financial, investment, or other advice. The author or any people mentioned in this article are not responsible for any financial loss that may occur from investing in or trading. Please do your research before making any financial decisions.




