
 no crying in the casino
 Pyth Network
 NEAR Protocol
 Starknet
 Quantus
 Pearl
Pearl Bitcoin

Key Insights:
- Bullish chart patterns and strong support drive Dogecoin‘s recent rally.
- Rising address activity signals increased investor interest in Dogecoin.
- Analysts predict potential Dogecoin growth, with varied target projections.
Dogecoin has recently experienced notable price action, rising from $0.17 to $0.19 between July 7th and July 11th. This recent surge has outpaced Bitcoin (BTC) and Ethereum (ETH).
This marks a shift in momentum for the cryptocurrency. Over the past 24 hours, Dogecoin has risen by 10.2%, while in the last seven days, it has surged by 19.3%.
This rally comes alongside a broader rise in the price of Bitcoin. It has seen increases of 6.28% in the last 24 hours and 8.34% over the past week. Analysts are now weighing whether this momentum will continue, with some predicting significant future gains for Dogecoin.
Technical Analysis: Dogecoin Chart Shows Bullish Megaphone Pattern
One of the most notable patterns in DOGE’s recent price action is the Bullish Megaphone pattern. It has emerged on the weekly chart. This broadening wedge is typically associated with increased volatility. It suggests that Dogecoin could be in the early stages of a strong upward trend.
According to the chart shared by TradingShot, Dogecoin’s price action has formed a Higher Low. It has been formed near the 200-week moving average (MA200). This level of support is critical as it suggests that the cryptocurrency may be poised to start a new bullish leg.
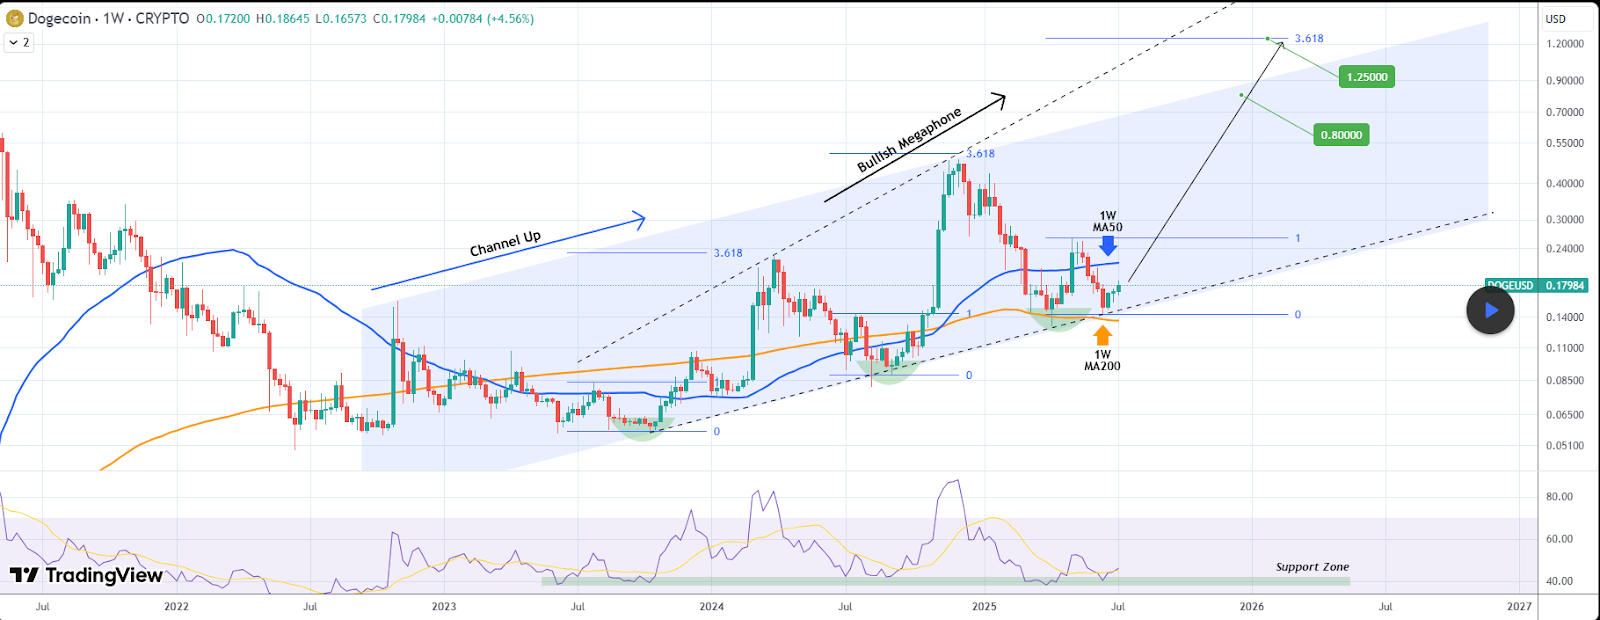
The formation of a Higher Low, particularly near the MA200, is a strong signal for further price increases. The 200-week moving average has provided robust support for Dogecoin, especially after the price bounced off the $0.14 level.
This price action signals a shift in momentum. This and other technical indicators indicate the potential for sustained growth in the coming weeks or months.
The RSI (Relative Strength Index) has also rebounded from a support zone around 40-42. It further reinforced the view that bullish momentum may be building.
Channel Up Pattern and Target Levels
DOGE price is trading within a Channel Up pattern, which has existed since early 2023. This parallel trend channel has seen Dogecoin respect both the upper and lower boundaries. With this, the price has consistently moved within these lines.
Dogecoin recently rebounded from the MA200, showing technical strength. Its current movement within the channel points to a continued upward trend.
Based on Fibonacci analysis, Dogecoin’s potential target levels are $0.8000 and $1.2500. The more conservative target sits within the current channel’s range. On the other hand, the more aggressive target at $1.2500 corresponds to the 3.618 Fibonacci extension.
This higher target, although ambitious, is not out of reach if the cryptocurrency continues its strong upward momentum. Analysts suggest that these targets represent the possible peaks of the current bull cycle. With this, $1.2500 marked the highest potential price in this run.
Rising Market Activity and Address Growth
Meanwhile, a high level of address activity in the market might have contributed to the recent rise in Dogecoin price. According to the daily active addresses chart, there was a massive increase in new and active addresses.
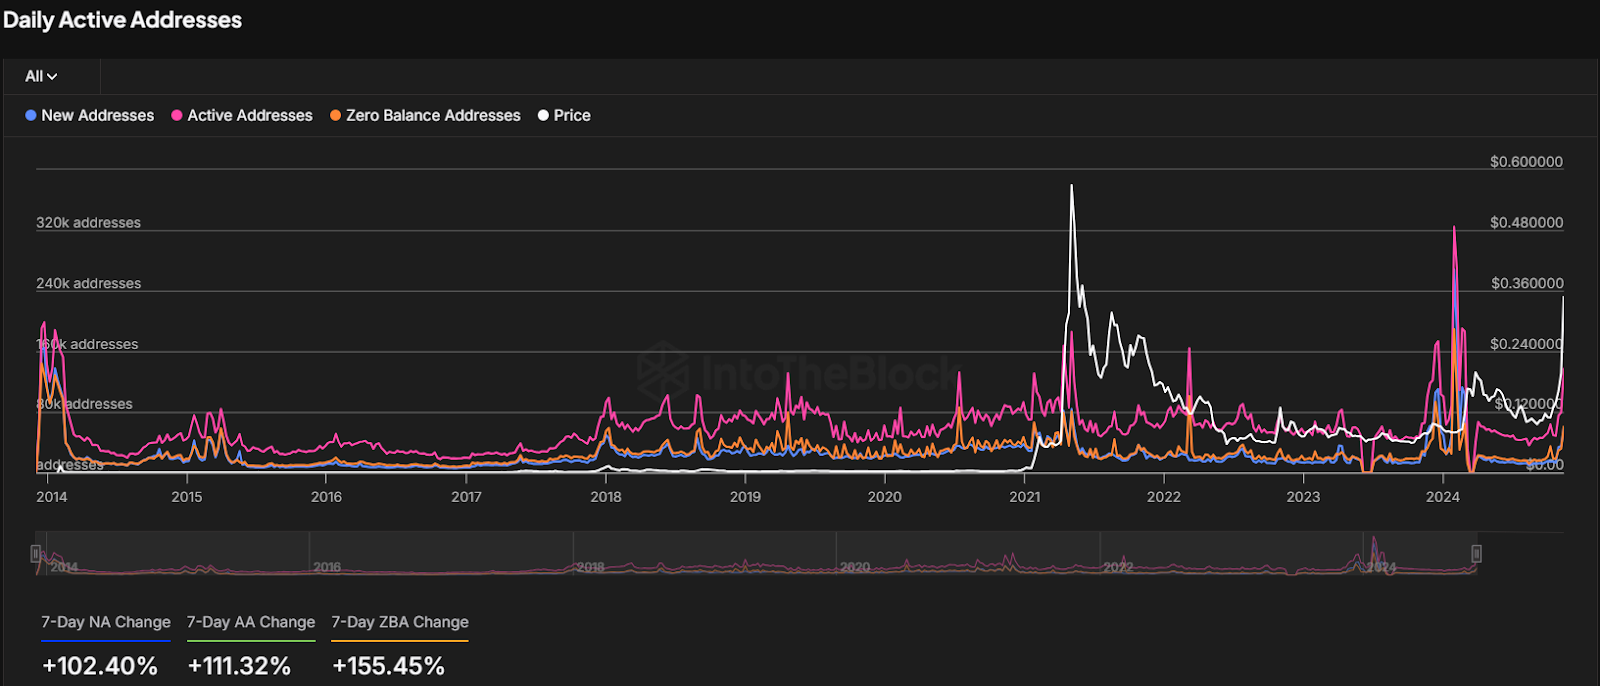
New addresses rose by 102.40% in the last 7 days, whereas active addresses grew by 111.32%. Also, there has been an increase in zero-balance addresses by 155.45%.
Dogecoin’s recent upward movement is attracting strong investor attention. The surge in buying activity suggests growing confidence and new positions being taken across the market.
The high number of addresses indicates that the Dogecoin network is gaining more users. This translates to adoption and increased participation. The increased activity would accelerate the trend further as more investors would likely purchase the cryptocurrency.
Dogecoin is gaining traction as more users enter the market. This growing interest could drive momentum, making it an asset worth watching closely in the coming weeks.
Disclaimer
This article is for informational purposes only and provides no financial, investment, or other advice. The author or any people mentioned in this article are not responsible for any financial loss that may occur from investing in or trading. Please do your research before making any financial decisions.




