
 Sword Inu
 no crying in the casino
 streamoors
 IGNITION
 Altai the Tiger
 Pearl
Pearl Quantus

Key Insights:
- Bitcoin price breaks out, forming an identical structure to the early 2024 rally.
- RSI and Awesome Oscillator confirm that bullish momentum is still intact.
- $120K resistance remains critical for the next move toward $140K.
Bitcoin price has been on a bull run as it hit a high of $117,635.92, approaching the $120,000 area. This has become a structural resistance area.
At press time, $BTC had slightly increased by 0.19%. However, generally, the price is on an upward trend. The 24-hour volume has steadily reduced by about 55%. It stood at only $56.72 Billion.
Bitcoin is present following a pattern comparable to one seen before, step by step, in early 2024. Charts show a comparable multi-period rally playing out. That formation came in the form of an ascending channel.
It was followed by a steep retracement and consolidation period, breaking into new all-time highs. Bitcoin price will behave in a four-phase paradigm this year and next. $BTC is leaving the triangle once again, a period of consolidation, presently above the $110,000 to $115,000 area.
Bitcoin Price Showing Cyclic Behaviour
In 2024, the Bitcoin price corrected to the area of $48,000. Further, it was corrected to the price of $40,000. This is followed by a consolidation slightly below the resistance level. This led to a vertical ascent of $70,000.
The price structure broke out into three sides of a triangle. It indicated a new confidence in the market with the participation of high volumes.
The same pattern is currently being replicated in 2025. Bitcoin price soared towards an initial high of around 119,000 in June.
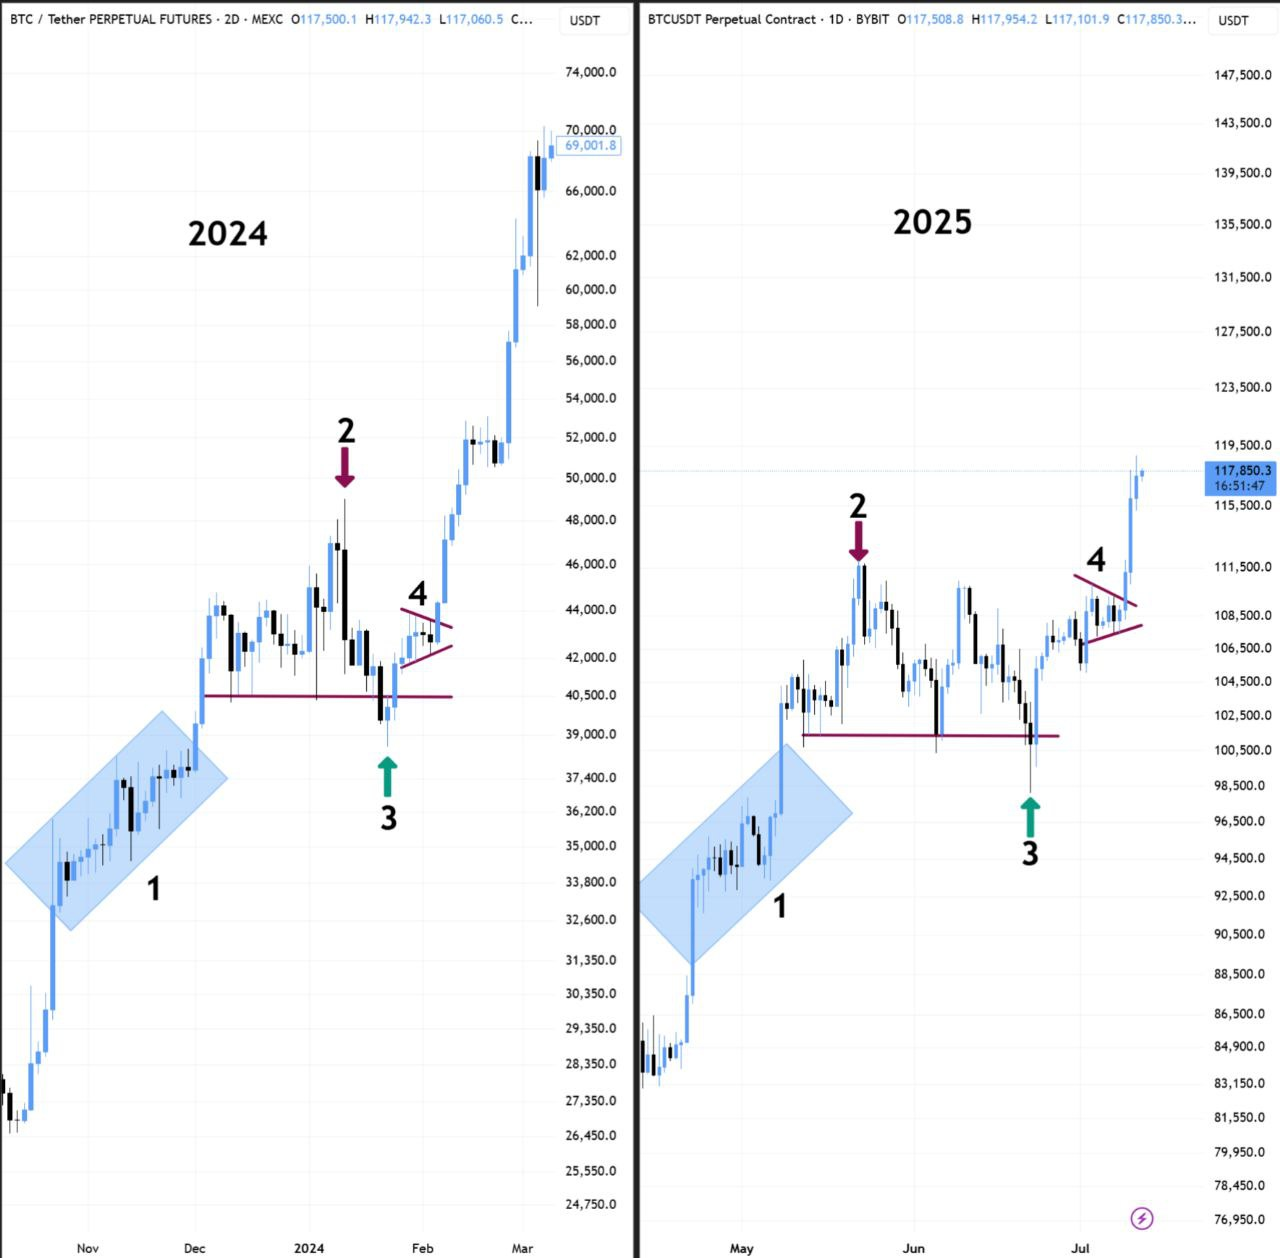
This is before pushing back to the 101,000 mark. It was only to form a narrowly triangular base around the 110,000 mark. The breakout of that structure this week has reinvigorated the posture of the bulls.
$BTC is also moving in a powerful bullish trending wave. The parallelism of the fractal structure suggests a continuation of the rally to a higher level. However, every leg has to be validated individually by volume and price.
The memory effect of old prices also plays a part, where historical market price areas have retraced trading territory. The February 2024 breakout stands as a psychological blueprint. It is pinning hopes on the next possible local top in the range of $135,000 to $140,000.
Technical Indicators Reinforce Bullish Structure
The recent daily candle close price above 117,000 has directed renewed attention to technical indicators. Relative Strength Index (RSI) stood at 73.11. This implied that the Bitcoin price entered the overbought zone.
Having RSI values above 70 at certain stages of the bullish market does not imply it is a reversal signal. It usually portends the underlying momentousness. This overbought situation is a characteristic of institutional bids and long-term holders relieving the pressure of the supply.
This is also confirmed by the Awesome Oscillator (AO). The AO histogram has gone bullish in strong mode, and the last bar closed at 5,869.86. According to this rapid increase in positive momentum, there is still an acceleration of price that has not yet been exhausted.
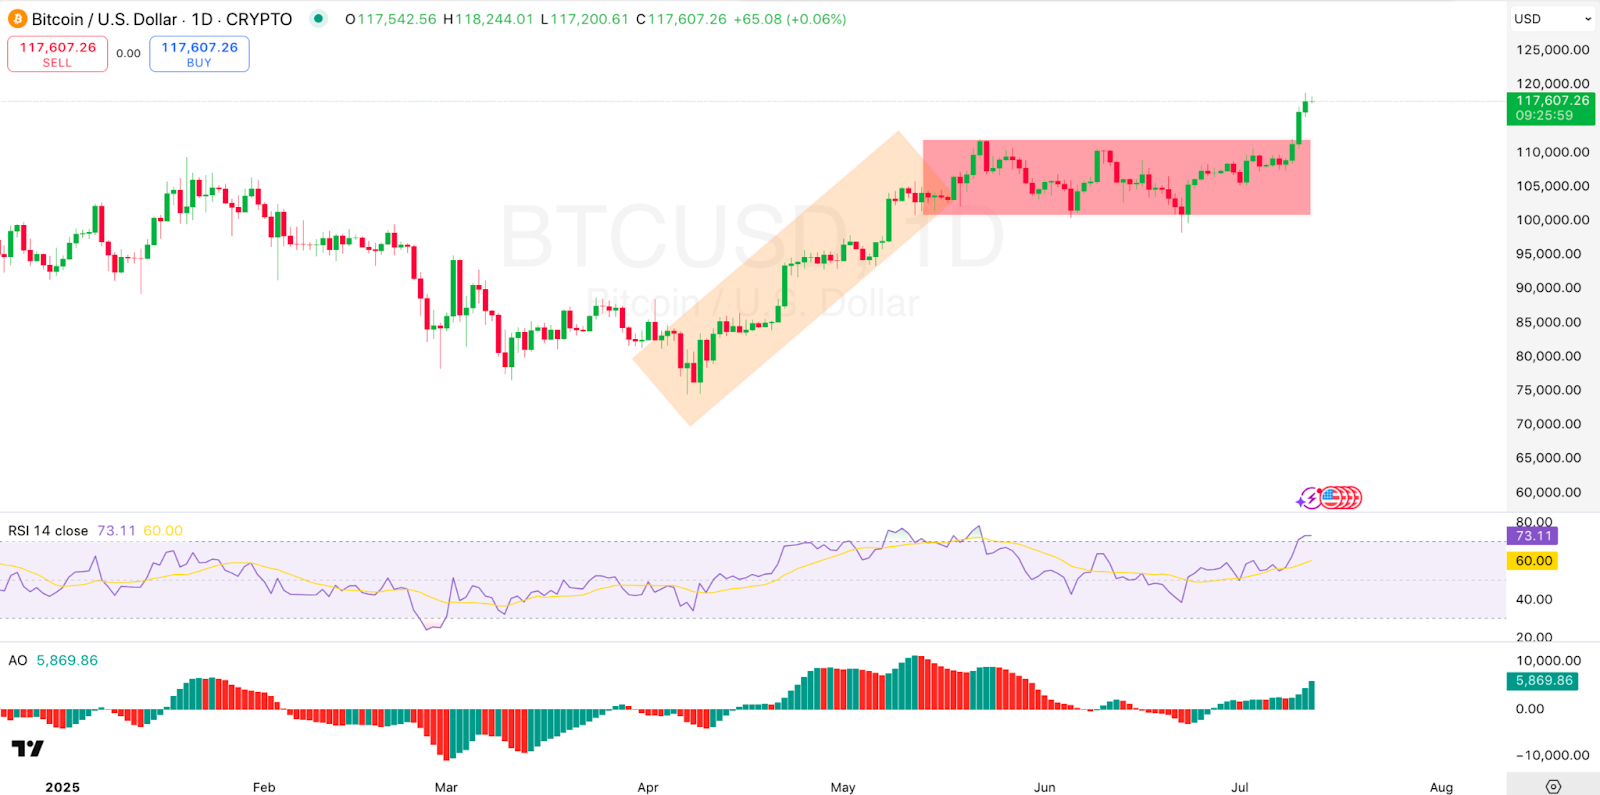
The current profile of the oscillator reminds of past arrangements that led to huge continuation moves. This is especially the one that saw the Bitcoin price rise to $70,000 in early 2024 after crossing the $46,000 mark.
Its trading volume compared to market cap is 2.46, demonstrating a clean turnover in a $2.3 Trillion asset. The total volume decreased on the last day. However, this could be a move into accumulation by the long-time holders as they left short-term speculative efforts behind.
Historically, the volume contract is broken down following a breakout. It was followed by an expansion after the new price level had been accepted.
What Next for the Bitcoin Price?
The latest break above the consolidation zone between $115,000 and $116,000. This is an influential turning point. It was a resistance band whose price had been in a horizontal range in this area for several weeks.
This breakout is a technical win; a support shelf is also made of that zone. If BTC bounces to this area, it will become a launching pad to initiate further gains. It could be seen considering that the overall trend is not collapsing.
To be more exact, the breakout puts the greater area of focus between $135,000 and $40,000 in the future. This is based on the measured move analysis. It is calculated against the height of the prior consolidation range and extrapolates the level.
Fibonacci extensions aligning in this range create a confluence zone of technical significance. Traders can use this zone to confirm potential price targets.
Significantly, there is no significant resistance in the range of $120,000 to $135,000. Due to this, the Bitcoin price may rise quickly as soon as authorities breach the ceiling of 120,000.
Disclaimer
This article is for informational purposes only and provides no financial, investment, or other advice. The author or any people mentioned in this article are not responsible for any financial loss that may occur from investing in or trading. Please do your research before making any financial decisions.




