
 Altai the Tiger
 IGNITION
 streamoors
 NEAR Protocol
 Sui
Sui Ethereum
 Pudgy Penguins

Key Insights:
- VeChain price gains over 6%, confirming recovery from long-term support as bullish volume and funding metrics rise.
- Analysts expect a potential rally to $0.12 after a double-bottom and Fibonacci-based setup.
- Derivatives and spot data show increasing investor interest, with the funding rate at a multi-month high of 0.0431%.
The global crypto market pulled back 1.1% as Bitcoin fell to $117,883, driven by its first ETF outflow since early June. Ethereum dropped 2.59%, while Solana remained the lone top-10 performer with positive gains. Total liquidations reached $556.94 million, pointing to increased leverage stress.
Gold futures rose 0.90% to $3,427.66, while the U.S. Dollar Index slipped 0.37% to 97.212, reflecting macroeconomic uncertainty. Bitcoin’s dominance increased by 0.69% to 60.14%, indicating capital rotation into major assets. The Fear and Greed Index stood at 71, remaining in “Greed,” although down from last week’s reading of 72.
VeChain defied broader weakness, rising over 6% to $0.0288 amid technical rebounds and ecosystem momentum.
VeChain Price Recovers Above $0.027 as Market Confidence Rebuilds
VeChain price rebounded strongly from the $0.024 zone, climbing past $0.027 with notable strength. According to CoinMarketCap, the token’s current price is $0.02772, with a market cap of $2.38 billion. Its 24-hour trading volume rose 6.77% to $87.44 million, reflecting renewed market participation.
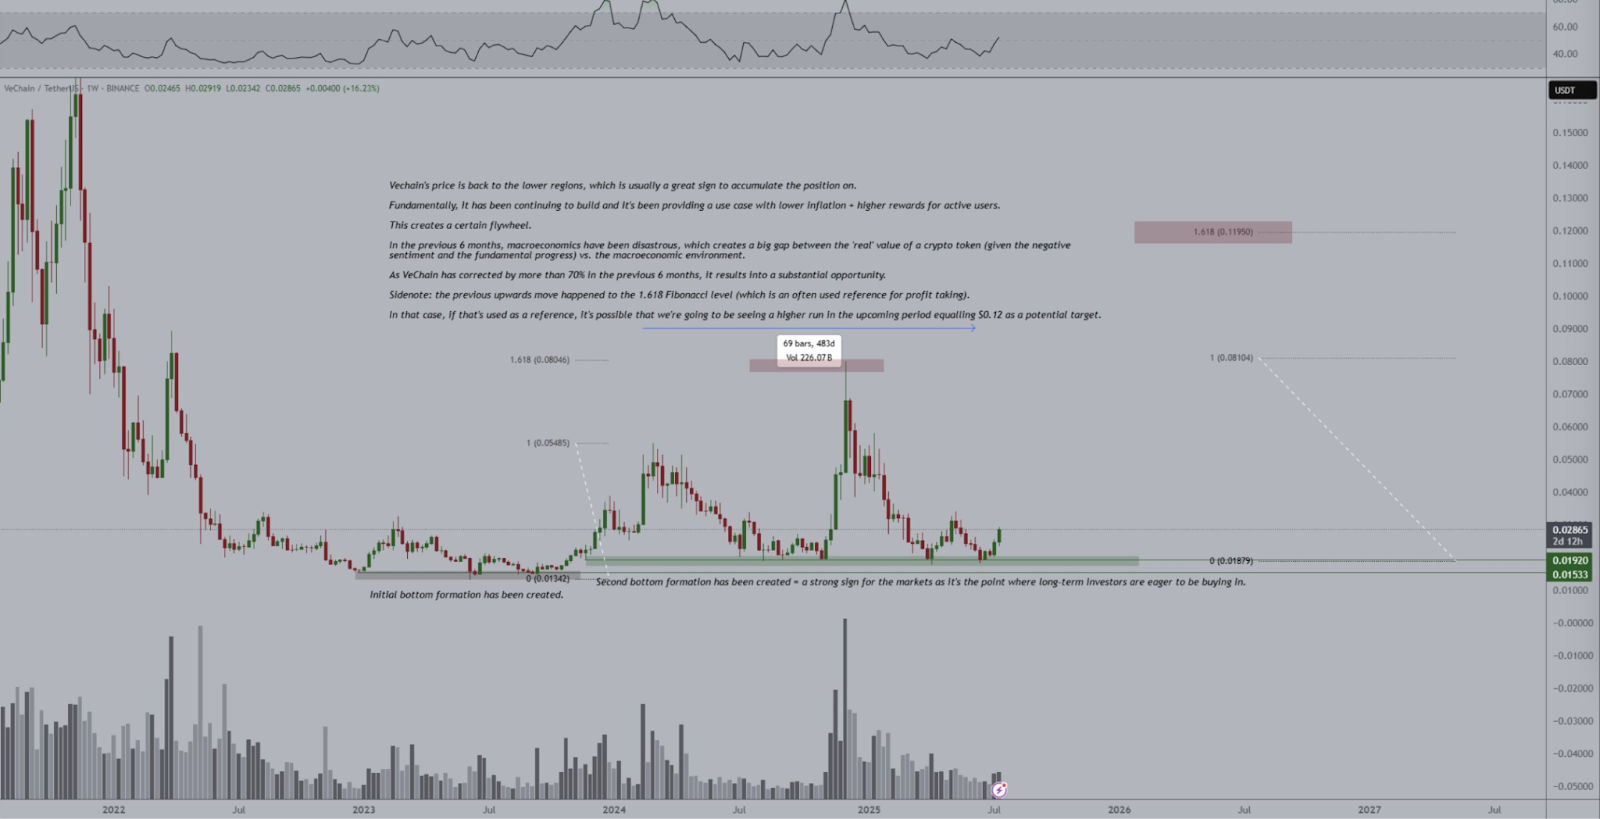
Technical indicators show VET has built a double-bottom structure around $0.01760 and $0.01879. This formation often shifts from accumulation to breakout, particularly with rising volume and strong support retention. The 200-day SMA near $0.03 remains the key resistance for any upside continuation.
Analyst Michaël van de Poppe pointed to the 1.618 Fibonacci level near $0.12 as a possible mid-term target. He cited VET’s over 70% correction as a buying opportunity, and emphasized the gap between VeChain’s on-chain development and broader macro sentiment. His analysis noted a previous 483-day cycle that ended at $0.11950, supporting his bullish projection.
Additionally, VeChain has widened its VeBetter ecosystem to more than 30 decentralized apps that target sustainability-oriented use cases. New platforms like EV Earn and Cleanify contribute to the ecosystem’s growing utility by incentivizing eco-friendly behaviors. The new Stargate release and tokenomics changes highlight the practical nature of the network, but the latest upgrades have not caused much of a stir in price behavior.
Derivatives Metrics Reveal Bullish Underpinnings Behind VeChain Price Rebound
VeChain’s derivatives market data from CoinGlass shows strengthening trader positioning. The volume increased by 4.08% to $108.49 million. In the meantime, the open interest decreased a little by 2.55% to $105.30 million, which indicates some position unwinding following the recent move.
Funding rates also indicate bullishness. The Rate was fairly unchanged between May and early July, trading below 0.015%. It has, however, been on the rise since mid-july, now at 0.0431%, the highest in the past 2 months. The increase indicates that long traders are becoming more willing to pay funding fees to keep positions on, indicating a belief in more upside.
Moreover, the 24h Long/Short Ratio is 0.926, and Binance VET/USDT has a greater ratio of 1.9394. Notably, leading traders on Binance are bullish biased with a Long/Short ratio of 2.6684 (accounts) and 5.71 (positions). This difference indicates that the experienced traders are optimistic despite the mixed retail.
Liquidation figures show that in the past 24 hours, 353.52K positions have been liquidated, with 341.78K being longs and 11.74K shorts. This skew shows that most liquidations were overleveraged long positions as the price encountered short-term resistance at around $0.028.
Spot Inflow/Outflow Confirms Rising Accumulation Activity
Furthermore, the VeChain Spot Inflow/Outflow chart indicates that net inflows prevail as the price started to recover. As of writing, VeChain was in net positive flows of around 7.6 million in the past week, a positive indicator of growing spot demand as the asset had bounced back to the 0.028 levels after hitting lows of 0.02100.
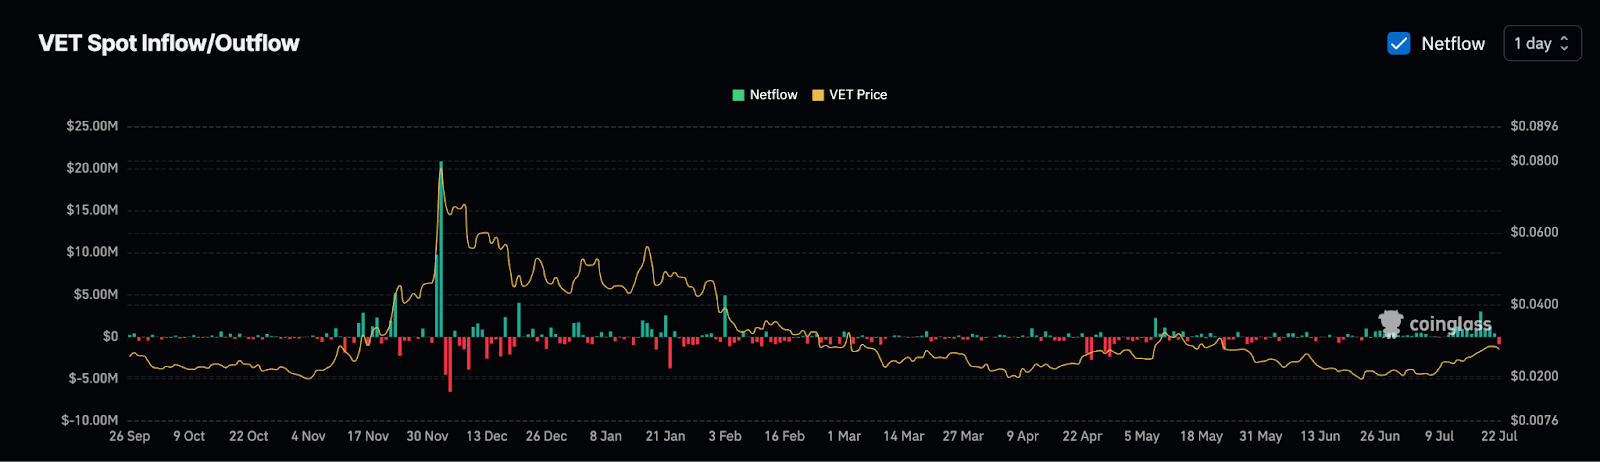
This is an indication of a trend that has moved away from the preceding period, which was characterized by outflows and stagnation, especially between March and late June. A lasting buildup in which the steady price action indicates institutional or long-term investor interest.
Disclaimer
This article is for informational purposes only and provides no financial, investment, or other advice. The author or any people mentioned in this article are not responsible for any financial loss that may occur from investing in or trading. Please do your research before making any financial decisions.




