
 astronaut
 Walrus
 Pearl
Pearl Bitcoin
 NEAR Protocol
 Zcash
Zcash Hyperliquid

Key Insights:
- Sui price broke out of a symmetrical triangle, now targeting the $7 level.
- Volume surged 25%, showing interest despite the 10% price drop.
- Vietnam expansion strengthens Sui’s Web3 gaming and developer ecosystem positioning.
Sui price has finished a breakout of a large symmetrical triangle formation on the 3-day chart. This setup represents the completion of consolidation. SUI finally closed over the upper resistance of the triangle around the $3.47 zone, showing a possible bullish continuation.
Fibonacci retracement indicates a battle at $0.786, with Fibonacci resistance found at the price of $4.20.
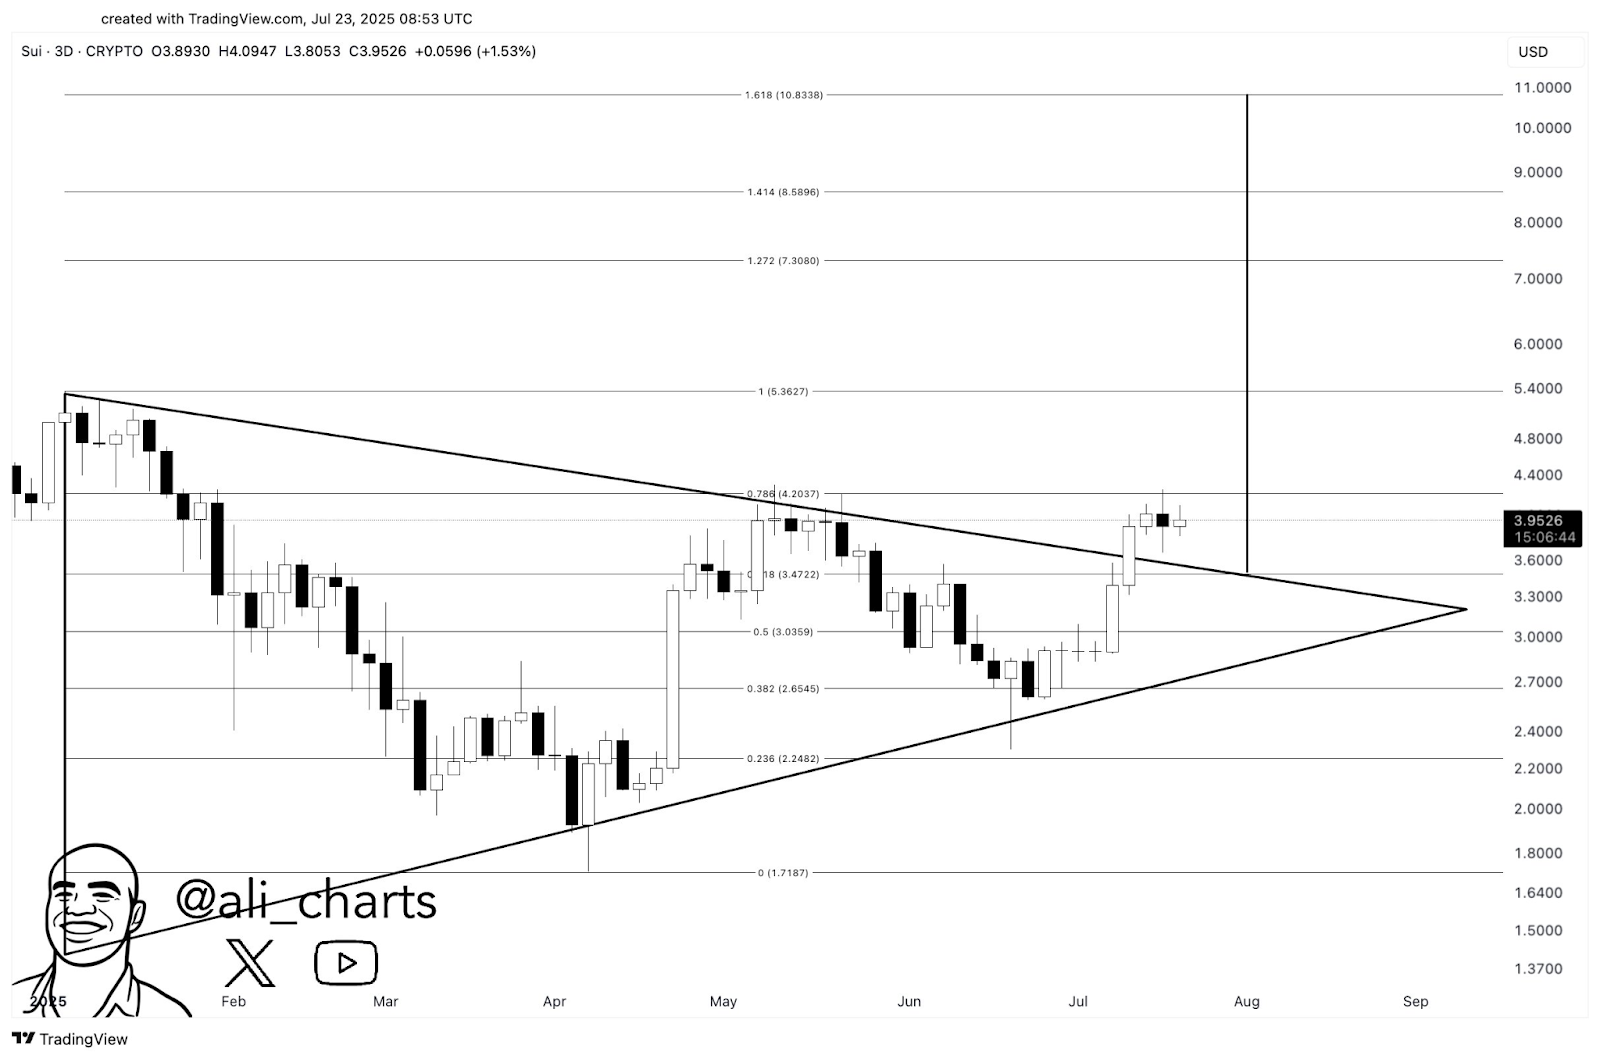
A thorough close above this level could confirm the breakout. It might create an opportunity to drive to the 1.272 Fibonacci extension point of $7.30.
Sui Price Correction Undermines Momentum, Falls Below $3.60
SUI price has experienced acute near-term selling pressure even though the breakout occurred. According to the data by CoinMarketCap, the price stood at $3.54 as of press time. It experienced a decrease of 10.7% in the past 24 hours.
This is a reversal occurred from the intraday peaks of $3.96 from the previous day. It shows overall volatility, supporting the rejection of the $4.20 Fibonacci level, which also increases the level of resistance in this area.
The Fibonacci zones at $3.382 and $2.65, and the breakout re-testing zone at $3.30USD now act as major support zones. Provided these are in place, the structure could still point to a bullish setup. However, a collapse of the price beneath these levels would cancel the bullish implication of the pattern.
Sui Price in a Falling Wedge, Hints at Rebound Potential
4-hour Sui price charts show a falling wedge pattern after peaking at slightly more than $4.00. This is a typical setup believed to be rather bullish. The wedge has almost been accomplished, and Sui price has just touched the lower line at around $3.50.
Charts show that it has now come back slightly towards the upper region, to the vicinity of 3.60.
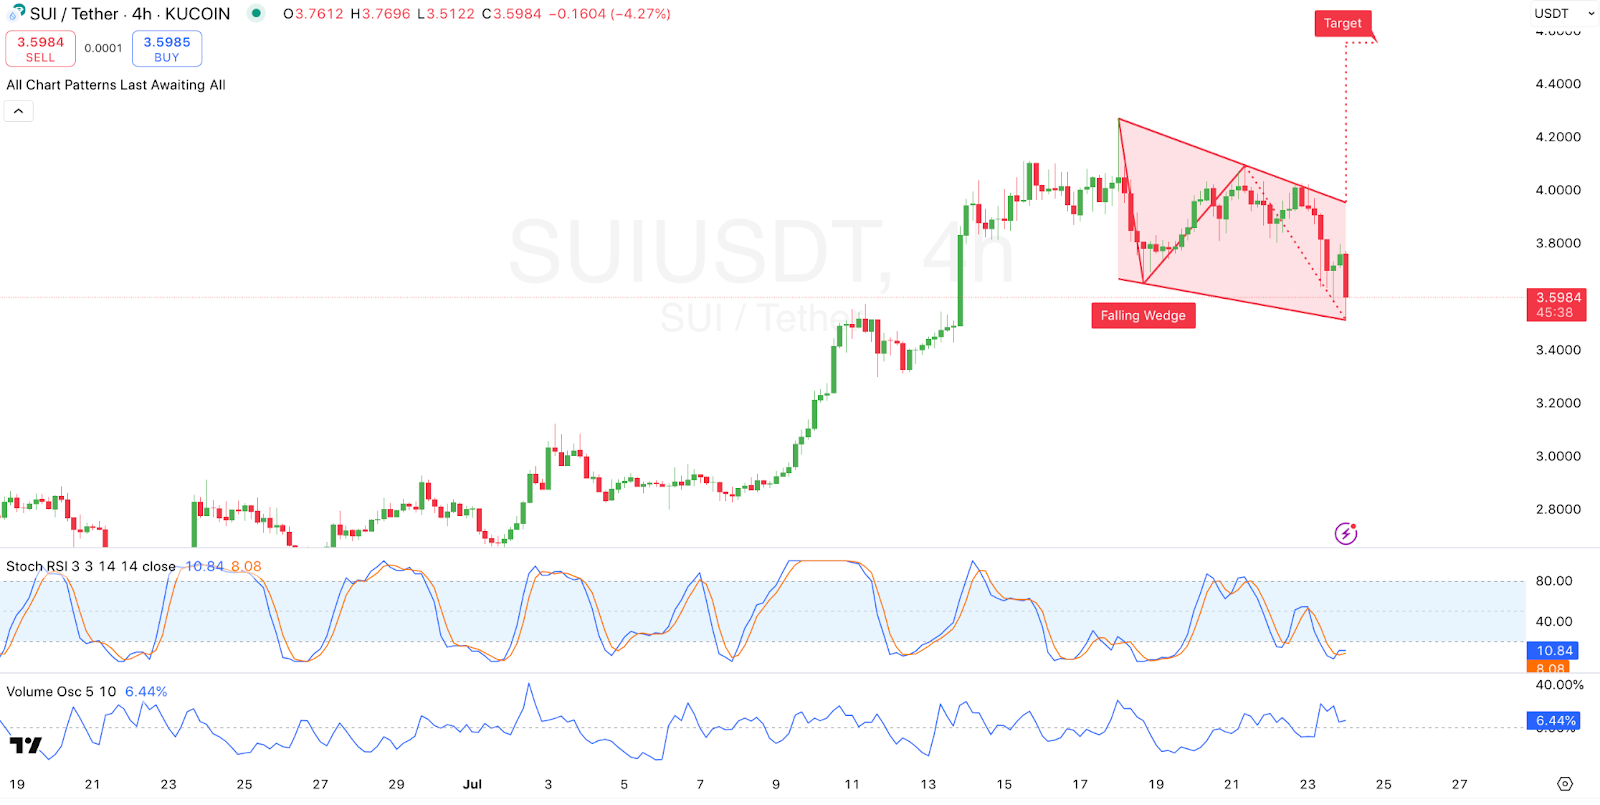
Divergences in volume oscillator show very mild interest in buying, as it stands at 6.44%. The Stochastic RSI is in an oversold region, with levels of 10.84 (blue) and 8.08 (orange). This is an indicator that the SUI price could be ready to take a step in the local reverse towards buyers.
Suppose the falling wedge is resolved to the upside, then short-term price objectives may be $4.20 once again. That’s with the potential of reaching $5.3. Such a breakout, however, must be validated with expansion of volume and closes above resistance lines.
Ecosystem Expansion into Vietnam Boosts Long-Term Outlook
In addition to the SUI price charts, the recent advancements in the ecosystem can also support Sui price. The protocol is making its way into the Vietnamese Web3 market, which is rapidly developing as a blockchain hub.
Vietnam has a population of more than 2.5 million IT specialists, and it is a prosperous environment to develop blockchain. Remarkably, blockchain-based games, such as Axie Infinity, have proven to gain a following in this region.
The utilization of the Move programming language by Sui provides it with a competitive advantage. Based on benchmark tests, Sui has the potential to work with a maximum of 120,000 transactions per second (TPS). This is way ahead of the TPS recorded in most Layer 1 rivals.
Statista predicts that the size of the crypto market in Vietnam could reach $2.3 billion by 2026. Sui has been positioned well in this ecosystem. It can be interpreted as a long-term ecosystem strategy due to its architectural advantages in the high-throughput, low-latency market.
Disclaimer
This article is for informational purposes only and provides no financial, investment, or other advice. The author or any people mentioned in this article are not responsible for any financial loss that may occur from investing in or trading. Please do your research before making any financial decisions.




