
 streamoors
 Sword Inu
 Altai the Tiger
 IGNITION
 no crying in the casino
 NEAR Protocol
 Pudgy Penguins
Key Insights:
- XLM crypto has taken support at the 15-day EMA, hinting at a potential price recovery.
- XLM failed to hold the key lower boundary of its consolidation range, opening the path for price drop.
- A crypto expert shared a post on X, noting that the next buy wall for XLM is at $0.38.
XLM crypto has finally broken out of its prolonged consolidation following a significant 110% price uptick. This breakdown appears to mark the beginning of a potential price correction in the coming days.
Current XLM Crypto Price and Expert Bold Prediction
At press time, the XLM crypto stands at $0.433, down 1.35% in the last 24 hours. During the Asian trading session, the price was even more lower and has record an intraday low of $0.4038. However, in the past few hours, an impressive recovery has been registered.
The ongoing price recovery has heightened the participation of crypto enthusiasts, leading to a 30% surge in trading volume.
As the market structure appears to be in correction mode, a crypto expert recently shared a post on X (formerly Twitter) stating that the next buy wall for XLM is at $0.38.
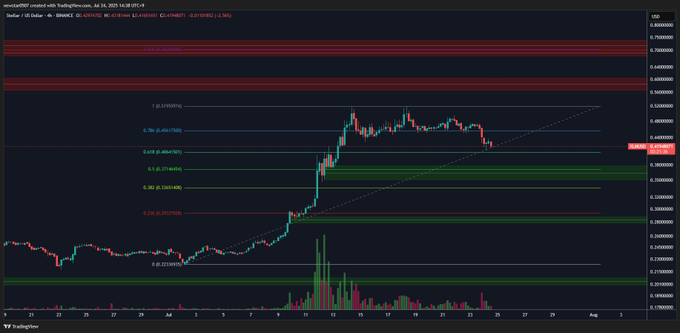
The expert’s post suggests that this could be an opportunity for traders and investors to bag some asset at the mentioned level. The post also cited the 0.5 Fibonacci retracement level as the reason behind this prediction.
On-Chain Metric: Bullish Activity By Traders and Investors
Meanwhile, investors and long-term holders have already begun their accumulation, as revealed by on-chain analytics tool Coinglass.
According to the data, since the beginning of the price decline, exchanges have seen nearly $8 million worth of XLM leave the exchanegs in the past 48 hours. This outflow of assets amid the current market sentiment strongly hints at investor accumulation.
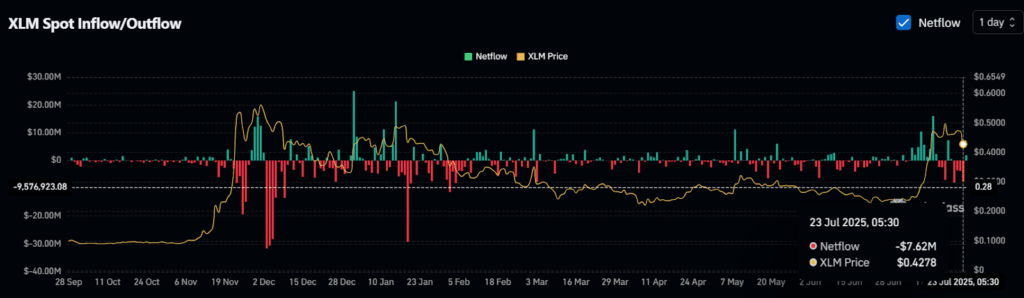
In the crypto landscape, such outflows are always seen as a bullish sign for holders, as they have the potential to increase buying pressure and fuel further upside momentum.
In the meantime, bullish activity by traders has already picked up. Coinglass data shows that traders’ bets on long positions have significantly increased over the past 24 hours.
At press time, the major liquidation level on the lower side is $0.3995, where traders have built $14.05 million worth of long positions. On the upper side, $0.4577 stands as another major liquidation level, with $3.84 million worth of short positions built.
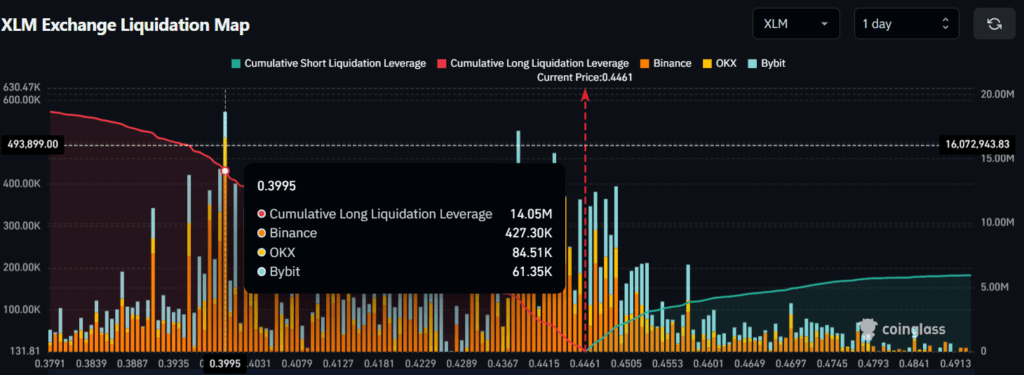
This on-chain data not only shows that bulls are currently dominating but also suggests that XLM doesn’t face any major resistance on the higher side.
XLM Cryto Support at $0.428, Reversal Pattern Forms
The daily chart of XLM crypto showed that the coin bounced off its 15-day Exponential Moving Average (EMA).
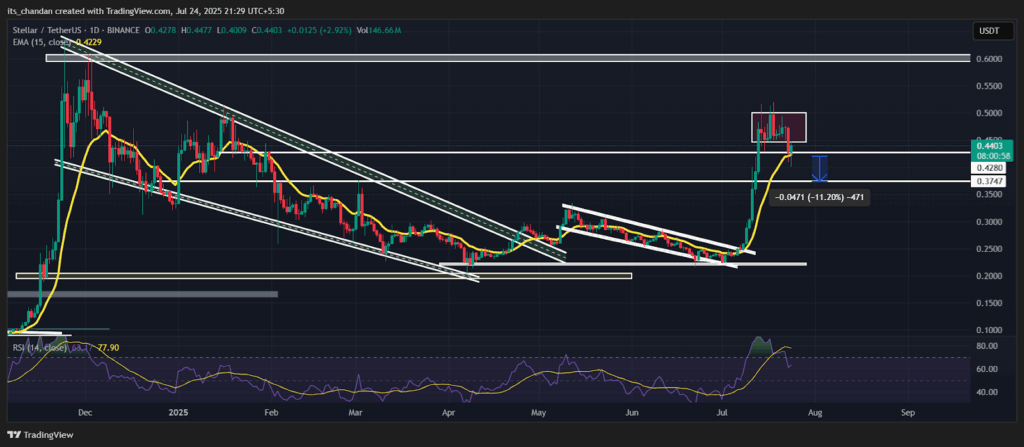
This EMA acted as dynamic support after the post-rally pullback. At $0.428, a key horizontal support level also aligned with price action.
If XLM holds this zone, the price could reverse higher in the coming sessions. A bullish hammer candlestick pattern appeared on the daily chart, hinting at a potential shift in short-term momentum.
The Relative Strength Index (RSI) hovered around 62. While near the overbought area, it still provided room for another leg higher if momentum builds.
If bullish volume returns, XLM crypto could retest and potentially break above the $0.50 resistance area.
Disclaimer
This article is for informational purposes only and provides no financial, investment, or other advice. The author or any people mentioned in this article are not responsible for any financial loss that may occur from investing in or trading. Please do your research before making any financial decisions.




