
 Zerebro
 Bitcoin
 Quantus
 Pearl
Pearl Starknet
 ZKsync
 NEAR Protocol
Key Insights:
- An expert predicted that if Avalanche (AVAX) breaks above $27, it could quickly climb toward the next key target at $36.
- AVAX price action suggests that AVAX is retracing to the 0.382 Fibonacci level.
- An outflow of $4.64 million worth of AVAX from exchanges hints at ongoing accumulation.
Avalanche (AVAX) has successfully retraced to the 0.38 Fibonacci level and now appears poised for another rally, supported by bullish price action. The asset has formed a strong bullish hammer candlestick pattern on the daily chart at a key support zone, signaling a potential price reversal.
Current Price and Experts’ Bold Predictions
This strong retracement has already started to take effect, as the price continues its bullish momentum. AVAX is currently trading at $24.09 and, despite the previous day’s downward pressure, the asset has still managed to gain 2.68% over the past 24 hours.
Amid this recovery, trader and investor participation has declined due to fears of a correction, resulting in a 24% drop in the asset’s trading volume compared to the previous day.
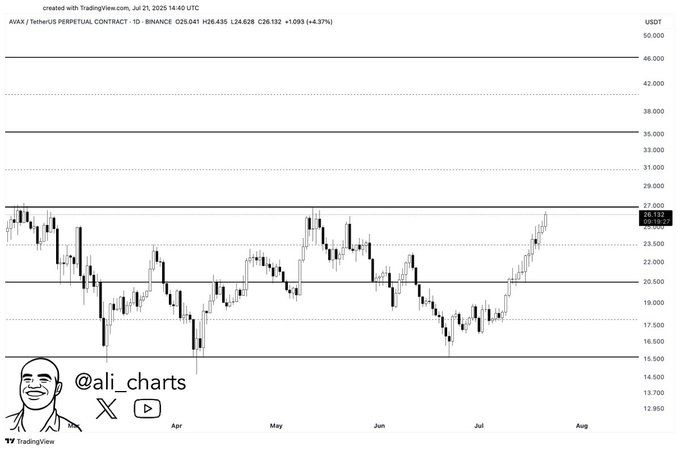
Though investors and analysts still appear bullish on AVAX, several of their posts are going viral on social media. A well-followed crypto analyst shared a post on X (formerly Twitter), boldly predicting that if AVAX breaks above $27, it could quickly climb toward the next key target at $36.
Another crypto expert shared a bold post, highlighting that AVAX is consolidating within an ascending triangle pattern and is currently facing rejection from a supply zone. The 200-day Exponential Moving Average (EMA) on the 2-day chart also acts as a barrier, causing the price to reverse.
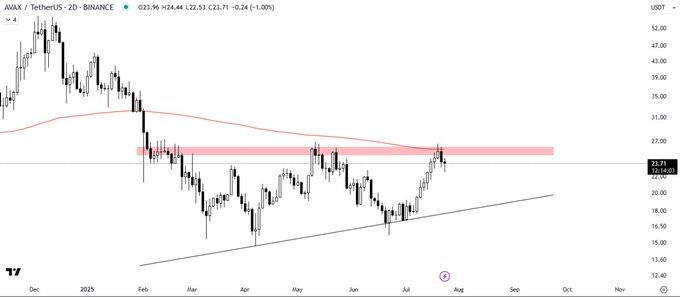
In the post, he reveals that a breakout from this pattern could signal a bullish trend, while continued rejection could lead to further consolidation.
These posts on X gained widespread attention from crypto enthusiasts.
Avalanche (AVAX) Price Action and Key Technical Levels
In addition to these experts’ commentaries on X, AVAX technical analysis reveals that the token is in an uptrend and, during the recent dip. Additionally, it has successfully retested the 200-day EMA and the 0.38 Fibonacci retracement level on the daily timeframe.
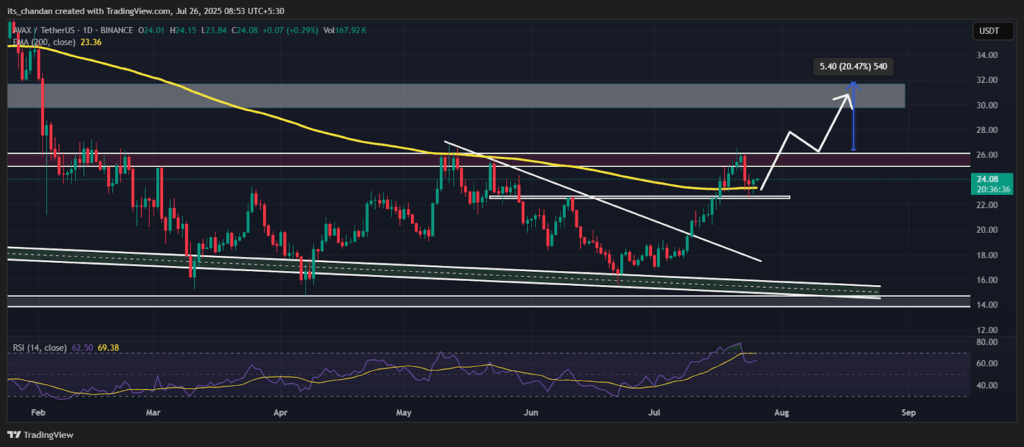
Moreover, following the retest, the asset formed a bullish hammer candlestick pattern at the retracement level, signaling a potential reversal.
Given the current market sentiment, the two major levels that could trigger significant upside or downside momentum are $26 on the upside and $22.50 on the downside.
Based on the price action between these two levels, the asset has been hovering within this range for the past nine days. A major upside rally could begin only if the AVAX daily candle closes above the $26 level. If this happens, the asset could see a 20% price jump and may reach the $31.80 level.
The Relative Strength Index (RSI) of AVAX has fallen below the overbought territory, suggesting that there is now room for significant upside momentum. The token may seize this opportunity and continue its upward price movement.
Bullish On-Chain Metrics
AVAX’s price action appears bullish, likely driven by ongoing accumulation by investors and long-term holders. Data from the on-chain analytics tool Coinglass reveals that over $8.25 million worth of AVAX tokens has left exchanges in the past 24 hours.
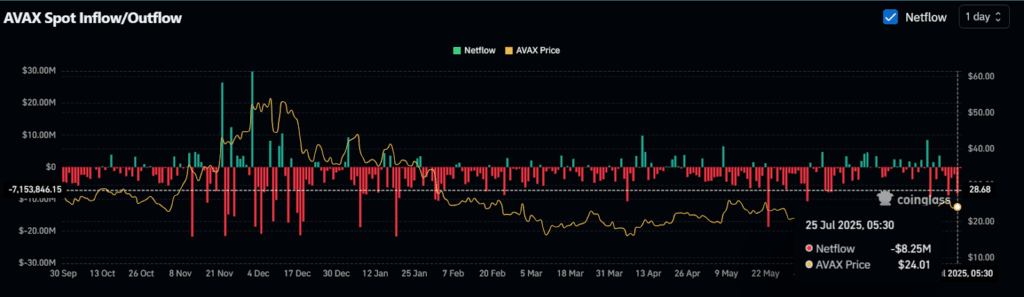
This outflow of tokens is a bullish signal for holders, indicating continued accumulation and growing interest in the token amid the market correction.
Now, when combining these on-chain metrics with technical analysis, the bulls are currently dominating the asset and could help support the ongoing uptrend.
Disclaimer
This article is for informational purposes only and provides no financial, investment, or other advice. The author or any people mentioned in this article are not responsible for any financial loss that may occur from investing in or trading. Please do your research before making any financial decisions.




