
 streamoors
 IGNITION
 Quantus
 Sui
Sui Zcash
Zcash Ethereum
 Pearl
Pearl
Key Insights:
- Amid the ongoing correction, ONDO price has formed a textbook-style Head and Shoulders pattern at a key resistance level.
- If the downside momentum continues, the asset could drop by 25% and potentially reach the $0.70 level.
- Despite the bearish price action, experts have made a bold prediction that ONDO is showing strength at this level, with a potential surge to $2 on the horizon.
ONDO Finance (ONDO) price, after losing 12% in the past 48 hours, appears to be turning bearish due to the formation of bearish price action patterns.
According to the daily chart, ONDO price recently broke out of a prolonged parallel channel pattern. It opened the path for an upside rally, but failed to sustain the momentum.
ONDO Price and Expert Bold Prediction
When writing, ONDO price is hovering near $0.98, having slipped 7.25% in the past 24 hours. It seems that fear of a potential price decline has increased trader and investor participation. That resulted in a 20% surge in recorded trading volume.
This surge in trading volume during the price decline suggests strong downside momentum and significant selling pressure.
Despite the fear of a potential price decline, a well-followed crypto analyst shared a post on X, noting that ONDO is showing strength at this level, with a potential surge to $2 on the horizon.
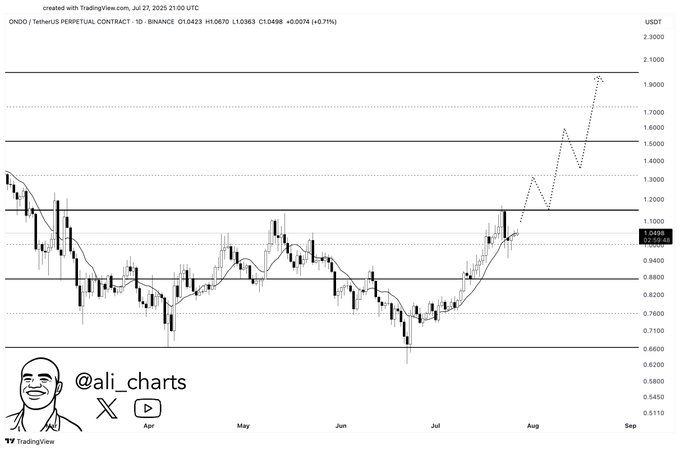
The post gained widespread attention due to the expert’s bold prediction. It comes at a time when the asset appears to be on the verge of further downside momentum.
Ondo Finance (ONDO) Price Action and Technical Analysis
The TradingView technical analysis on the daily time frame reveals that ONDO is in an uptrend. However, it has now formed a bearish head and shoulders pattern and is on the verge of a breakdown.
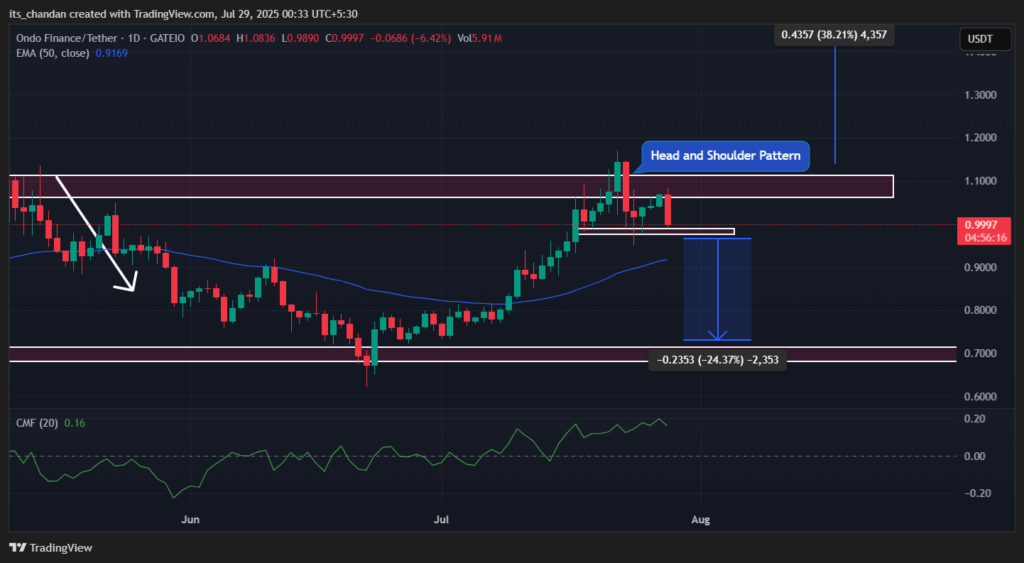
If the downside momentum continues and the price falls and closes a daily candle below the $0.96 level, a significant decline could follow. In that case, ONDO price could experience a drop of over 24%, with the price potentially reaching the $0.75 level.
However, if the ONDO crypto holds above this neckline, there could be a chance of a price reversal. Thus, the asset may gain upside momentum, potentially soaring by 10%.
Despite the bearish price action, ONDO’s Chaikin Money Flow (CMF) stands at 0.14. It indicates a steady inflow of capital and underlying buying pressure that could support a potential price rebound.
Meanwhile, the 200-day Exponential Moving Average (EMA) is positioned below the asset, suggesting that it remains in an uptrend.
On-Chain Metrics: Bearish Sentiment Intensifies
Given the current market sentiment and ONDO’s structure, it appears that investors and traders have been accumulating the token and seizing the dip as a buying opportunity, as revealed by the on-chain analytics tool CoinGlass.
However, data shows that exchanges have continued to see an inflow of tokens from wallets over the past few days, suggesting potential dumping. Over the past 24 hours alone, this inflow was recorded at $732K worth of ONDO.
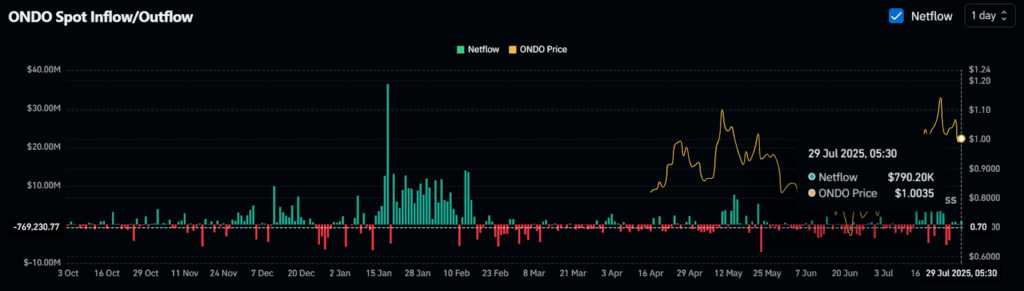
This influx of tokens into exchanges is a bearish signal. It indicates potential selling pressure that could trigger further downside momentum.
Not just investors, but traders also appear to be strongly betting on short positions. According to CoinGlass data, today’s major liquidation levels are $0.959 on the lower side and $1.033 on the upper side, where traders are over-leveraged.
The data further reveals that if the current market sentiment persists and the price falls below the $0.959 level, nearly $3.56 million worth of long positions will be liquidated. Conversely, if sentiment shifts and the price rises above the $1.033 level, it could trigger the liquidation of $6.95 million worth of short positions.
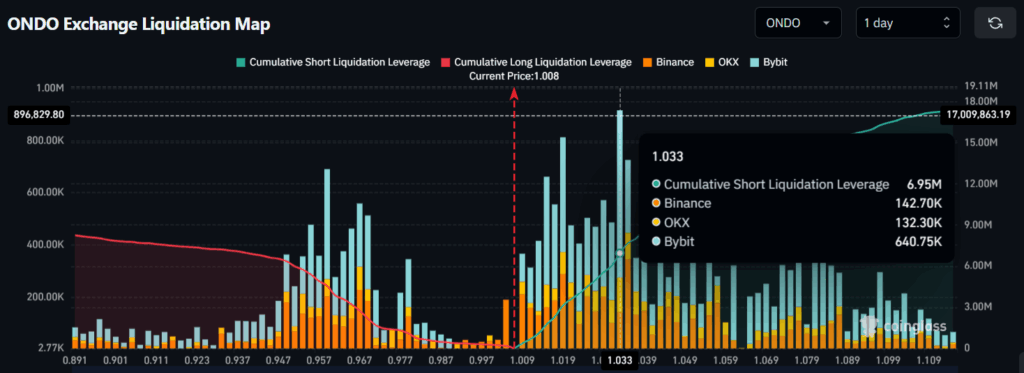
This data highlights traders’ positions and indicates that sentiment around ONDO price remains bearish. Combining these on-chain metrics, it appears that bears are currently dominating the asset.
Disclaimer
This article is for informational purposes only and provides no financial, investment, or other advice. The author or any people mentioned in this article are not responsible for any financial loss that may occur from investing in or trading. Please do your research before making any financial decisions.




