
 streamoors
 Altai the Tiger
 Sword Inu
 IGNITION
 no crying in the casino
 Quantus
 Pearl
Pearl
With a 7% downside momentum, the Chainlink price has confirmed a bearish outlook and is poised for further slide. The potential reason behind this bearish outlook is the recent breakdown of the head and shoulder pattern, along with broader market sentiment.
Chainlink (LINK) Price Action and Key Technical Levels
According to the TradingView chart, the Chainlink price has successfully broken out of the bearish Head and Shoulder pattern on the four-hour chart.
Following this breakdown, the sentiment appears to be completely shifted towards the bearish side, as no support near can hold LINK’s downside momentum.
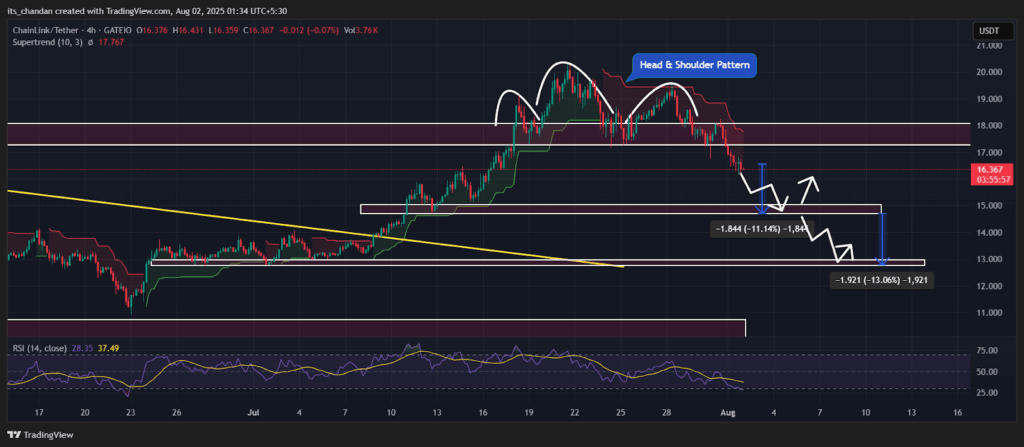
Meanwhile, the price action and historical pattern suggest that this breakdown has opened the path for a 12% price dip until the Chainlink price reaches the $15 level in the future. Moreover, if the downside remains unchanged, it could press the asset another 13% until it reaches the next support at $13.
At press, LINK’s Relative Strength Index (RSI) stands at 28, indicating that the asset is in an overbought territory. In this case, the asset may face a short-term price rebound if buying pressure emerges and continues to decline.
Not just that, another technical indicator, Supertrend, has flipped to bearish, as it is currently flashing red and further strengthening Chainlink’s bearish outlook. This red Supertrend hints at rising selling pressure and further downside momentum in the asset.
So far, the Chainlink price has lost 7% of its value over the past 24 hours, and it stands at $16.30 level. However, traders and investors’ participation amid this sentiment has soared significantly.
Data from CoinMarketCap reveals that Chainlink’s 24-hour trading volume has jumped by 58% from the previous day.
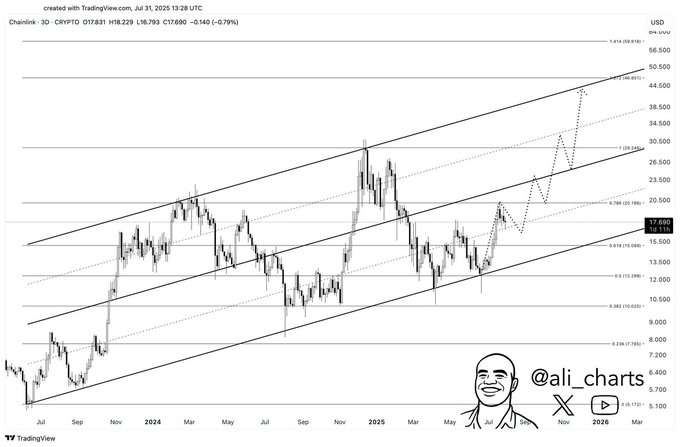
Given the current market sentiment and recent price dip, a well-followed crypto expert shared a post on X (Formerly Twitter) that the bullish outlook remains intact as long as the Chainlink price maintains itself above the $13 level.
Bullish On-Chain Metrics: Whales Rising Interest
This post on X gained widespread attention from crypto experts and further suggests an ideal buying opportunity, as the on-chain data explains.
Data from the on-chain analytics tool IntoTheBlock reveals that Chainlink’s large transaction volume, which is typically linked with whales and institutions, has soared by 28%. This suggests rising interest in the asset as the price dips significantly.
In addition, another metric reveals that whale transactions ranging between $100k – $1 million and $1 million to $10 million have surged by 73.13% and 5%, respectively, over the past 24 hours.
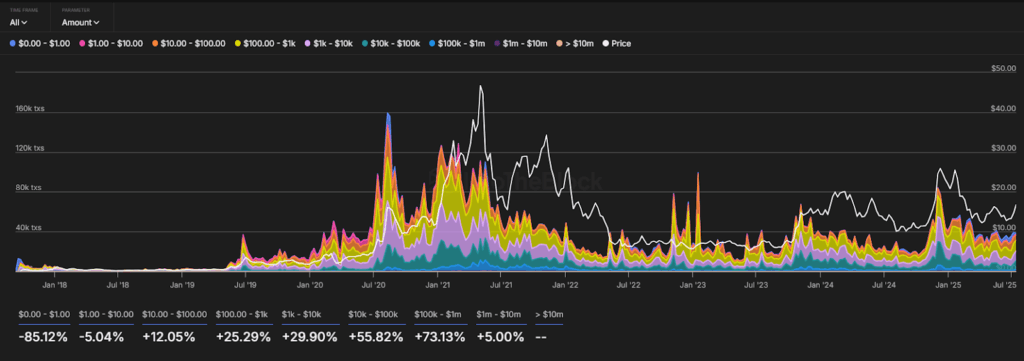
This surge in whale activity appears to be an accumulation, as revealed by the on-chain analytics tool Coinglass.
Data from the spot inflow/outflow have demonstrated that Exchanges across the crypto landscape have recorded an outflow of $7.05 million worth of LINK tokens over the past 24 hours. In the crypto landscape inflow of assets from the exchanges hints at an accumulation and can lower the selling pressure.
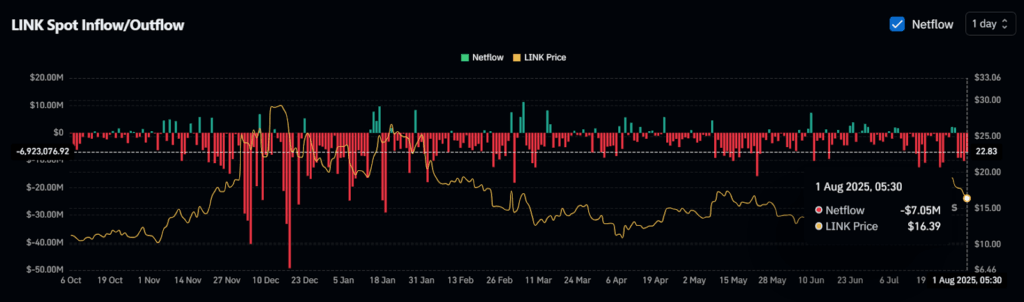
When combining these on-chain metrics, bulls are seizing the current dip as an opportunity to buy, taking advantage of the price decline.




