
 Pearl
Pearl Walrus
 Starknet
 Quantus
 Bitway
 Sui
Sui Zylo Ecosystem
Key Insights:
- Ethereum price correction aligns with bearish divergence on lower timeframes.
- Global liquidity supports a bullish ETH outlook despite current volatility.
- BlackRock ETH ETF stability signals strong institutional confidence in Ethereum.
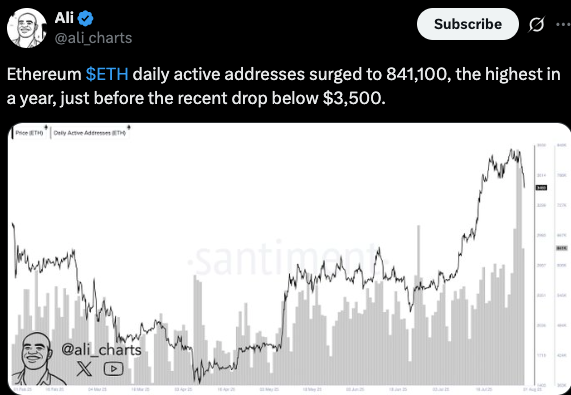
Ethereum price has slipped below the $3,500 mark shortly after a surge in network activity was observed. Daily active addresses on the Ethereum blockchain soared to 841,100, marking the highest count recorded in the past year.
This spike in activity, according to market observers, often signals growing user engagement or potential shifts in investor behavior. The data, illustrated by Santiment and shared by crypto analyst Ali on X, shows a clear divergence between address activity and price movement.
Despite the surge in address count, Ethereum faced a downward price adjustment, triggering speculation about the timing and cause of the sell-off.
Analysts suggest that large on-chain activity doesn’t always equate to bullish momentum, especially if profit-taking or fear of market downturns sets in.
Ethereum has been trading in a volatile range in recent weeks, influenced by broader macroeconomic factors and crypto market sentiment. This development serves as a reminder that on-chain metrics, while insightful, don’t always align with short-term price action.
BlackRock Holds Steady: No Ethereum ETF Outflows
BlackRock’s Ethereum (ETH) ETF has reported zero outflows amid the latest market correction, signaling strong investor conviction. Despite broader volatility in the crypto sector, BlackRock’s fund has maintained its holdings without a single withdrawal.
This unusual stability during a downturn suggests that institutional investors are holding firm rather than reacting to short-term market pressure.
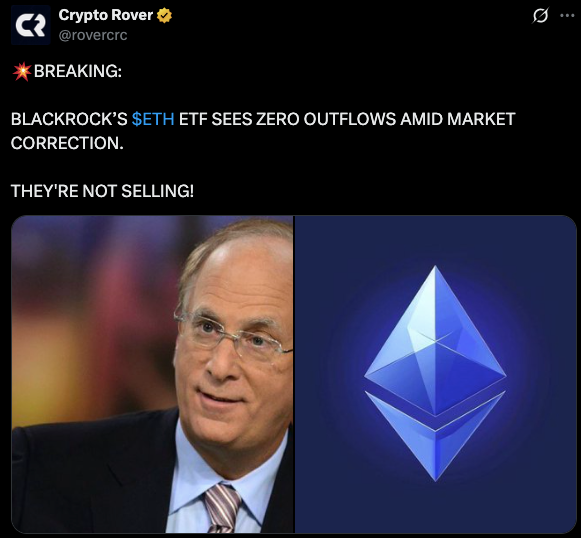
Analysts interpret the lack of outflows as a clear show of confidence in Ethereum’s long-term value. While the dip may unsettle retail traders, BlackRock’s steady position could influence broader market sentiment. The ETF’s resilience highlights the growing role of institutional backing in shaping crypto market dynamics.
The trend in the Ethereum market has gained the attention of traders again as analysts highlight its correlation with the global liquidity dynamics. A chart shows that Ethereum (ETH) is following the M2 Global Money Supply.
The post also points out the current pairing of ETH with Tether (USDT), which is at 3,488.54 and experienced an insignificant drop of only 0.03%. Such a steep positive curve in the graph indicates a high bullish momentum, which might be a precursor of a raging.
Ethereum Price Slips Below $3,500: Will Bulls Regain Control?
The ETH price traded at $3,475 on August 2, 2025, continuing its downward slide beneath the $3,500 mark.
The price was reverted considerably, to a local high of around 3,880. This retreat was ingrained in the $3,470 region, where buyers were trying to create a base of support.
The 4-hour time frame showed that a stronger move to the downside came into play, with Ethereum breaking below an area of support around $ 3,600. This disparity escalated following numerous recreation efforts that failed. Volume of sales went up, and the price was brought further into a new low on a short-term basis.
Additional technical confirmations came from the technical indicators, which showed a weakening structure.
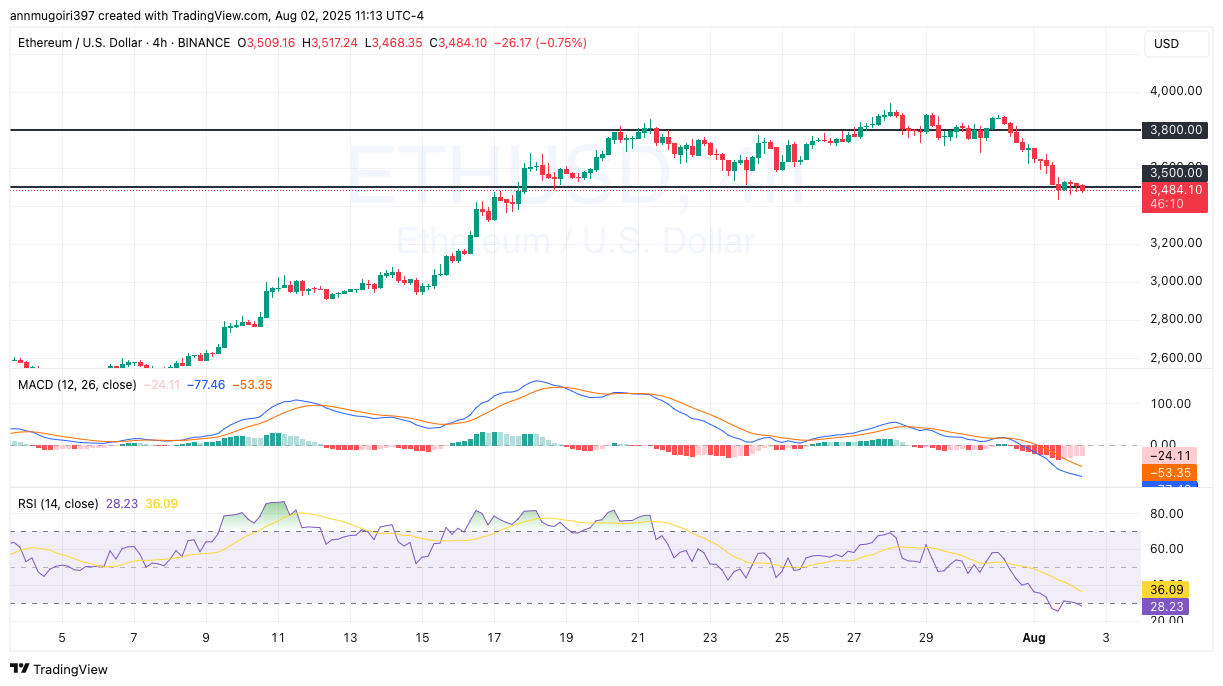
The Moving average convergence divergence (MACD) was still in negative land, indicating further bearish divergence. The MACD moving average line was also far below the signal line, confirming the down trend.
In the meantime, the Relative Strength Index (RSI) went to 27.77, which indicates a definite oversold state.
The market structure looks exposed to another fall should Ethereum not rebound above the $3,500 mark. A breakdown and stabilization below the key level of $3,470 would result in another leg down to $3,200.
Disclaimer
This article is for informational purposes only and provides no financial, investment, or other advice. The author or any people mentioned in this article are not responsible for any financial loss that may occur from investing in or trading. Please do your research before making any financial decisions.




