Dacity Coin
 Quantus
 Pudgy Penguins
 Pearl
Pearl Injective
 Starknet
 NEAR Protocol
Key Insights:
- $5.45 million worth of HBAR crypto outflow from exchanges hints at ongoing buying activity.
- HBAR recorded a golden cross of the 200 EMA and 50 EMA on the daily chart, indicating strong upside momentum ahead.
- The major liquidation levels are $0.2511 and $0.264 on the lower and upper sides.
Hedera (HBAR) appears to be facing a price correction after an impressive 15% price uptick recently. This price correction emerged on the daily chart at a key resistance level, which has a history of price reversal and is now raising concerns of a potential price dip ahead.
HBAR Crypto Current Price Momentum
Looking at the daily chart and price momentum, history repeats itself again. HBAR price has slipped 3.45% in the past 24 hours and currently stands at a $0.2576 level.
The potential reason behind this drop is the profit-taking, historical patterns, and overall market sentiment.
The current market sentiment and recent price dip have dropped investors’ and traders’ participation, leading to 9% drop in the trading volume recorded.
Bullish On-Chain Metric
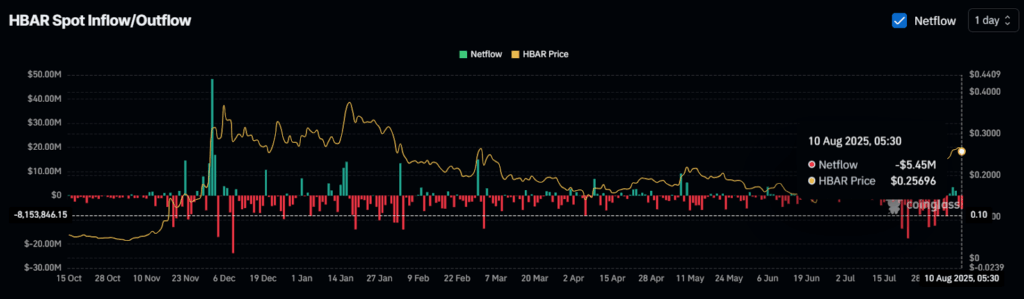
Despite ongoing correction, investors and long-term holders appear to be accumulating, as reported by the on-chain analytics tool Coinglass.
Data from the spot inflow/outflow shows that $5.45 million worth of HBAR tokens has left the exchanges over the past 24 hours. This metric hints that the flow of assets from exchanges is typically linked with potential accumulation and hints at ideal buying opportunities.
Meanwhile, traders found themselves strongly betting on the bullish side. As per the on-chain data, $0.2511 and $0.264 are the two major liquidation levels, where traders are over-leveraged.
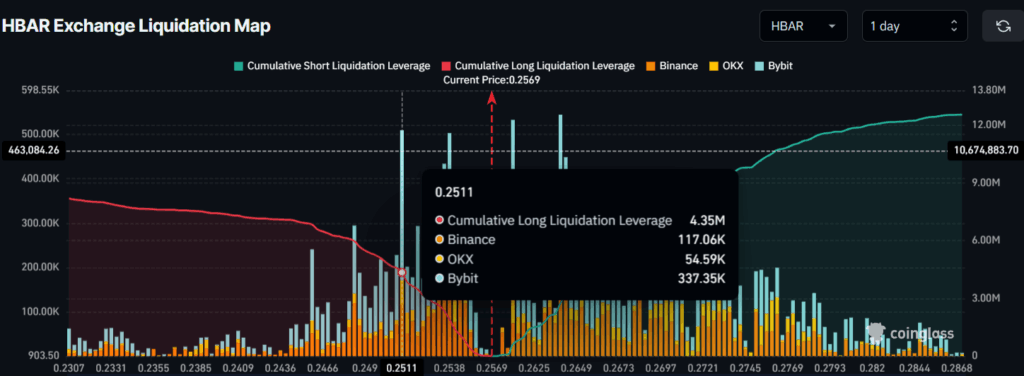
These data further reveal that these traders have placed $5.35 million worth of long positions and $2.75 million worth of short positions at these levels. Additionally, these levels could be liquidated if the price of assets moves on either side.
When combining the on-chain metrics, bulls strongly dominate the asset and push it to move upward.
HBAR Crypto Technical Analysis and Key Level to Watch
According to technical analysis, HBAR is in an uptrend but facing a small correction. This price correction emerged at a resistance level of $0.26, with a strong price reversal history.
Since February 2025, the HBAR price has reached this level multiple times and has also attempted to breach it, but each time it has failed and recorded a downside momentum.
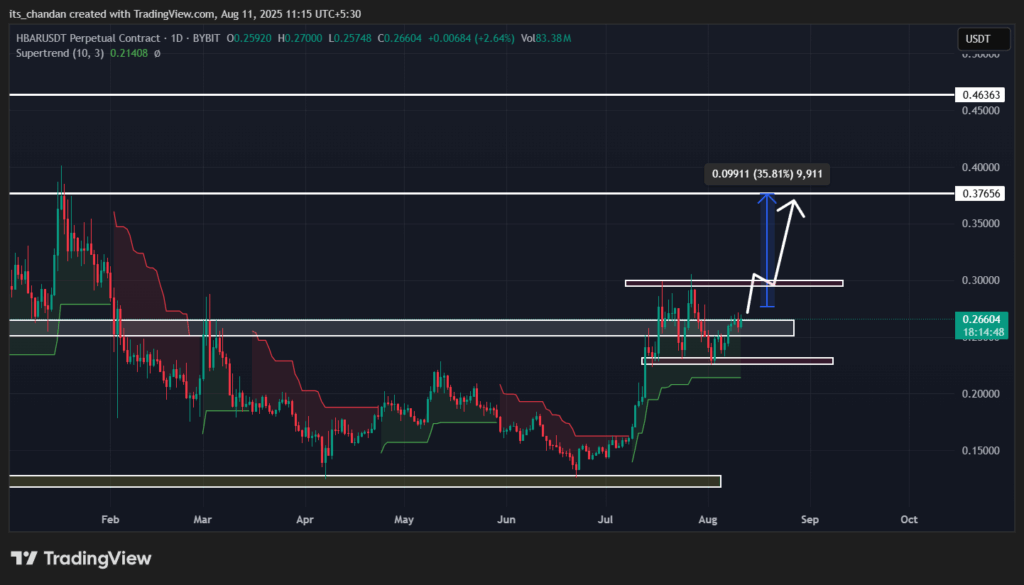
Based on the recent price action, HBAR could only end this price reversal this time by breaching and closing the daily candle above the $0.273 and $0.30. If this occurs, the asset could soar by 35%, and during this price, it could reach the $0.376 level.
On the other hand, if the momentum fails, history will repeat again and the price may fall to the $0.229 level.
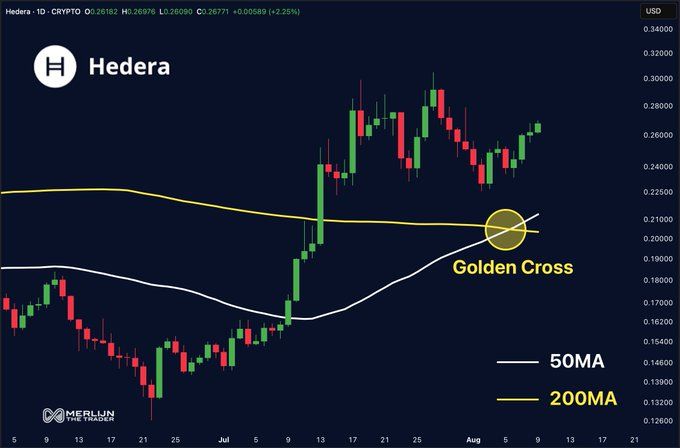
Given the current market sentiment, a crypto expert recently shared a post on X (formerly Twitter), noting that a Golden Cross has been confirmed.
According to the daily chart, HBAR’s long-term trend has flipped bullish as the 50-day Exponential Moving Average (EMA) has moved above the 200-day EMA, which is considered a key long-term trend indicator. The post also mentioned that bulls are loading and momentum is building.
At press time, the Supertrend indicator has turned green, and the price has moved above it, indicating that the asset is in an uptrend with bulls in control.