
 streamoors
 Altai the Tiger
 Sword Inu
 IGNITION
 no crying in the casino
 Quantus
 NEAR Protocol

Shiba Inu price has underperformed other cryptocurrencies this year as it moved from one of the most popular coins into a fallen angel. SHIB token was trading at $0.00001390 on Wednesday, much lower than the November high of $0.000033.
Still, the ongoing SHIB price action will likely reward patient investors in the long term. It has formed a highly bullish harmonic pattern on the weekly chart. There are also signs that it is in the accumulation phase of the Wyckoff Theory.
Harmonic Chart Pattern Signals a Shiba Inu Price Surge
One potential bullish catalyst for Shiba Inu price is that it has slowly formed the highly bullish XABCD harmonic pattern on the weekly chart. This pattern comprises of five points, starting with X, which is a significant swing high. In this case, X was at $0.000045, its highest level last year.
SHIB price then moved to the second point A, its lowest level in July last year. It formed B and C in November and June this year, respectively. It will move to the final stage D when the bullish breakout happens.
D will coincide with $0.00004572, its highest level in 2024, about 230% above the current level. First, the key level will need to be flipped at $0.000034, which is the B section, to confirm this breakout.
One caveat about this harmonic pattern is that it often takes week or months to complete. For example, phase XA happened between March and August last year, while AB took three months to complete.
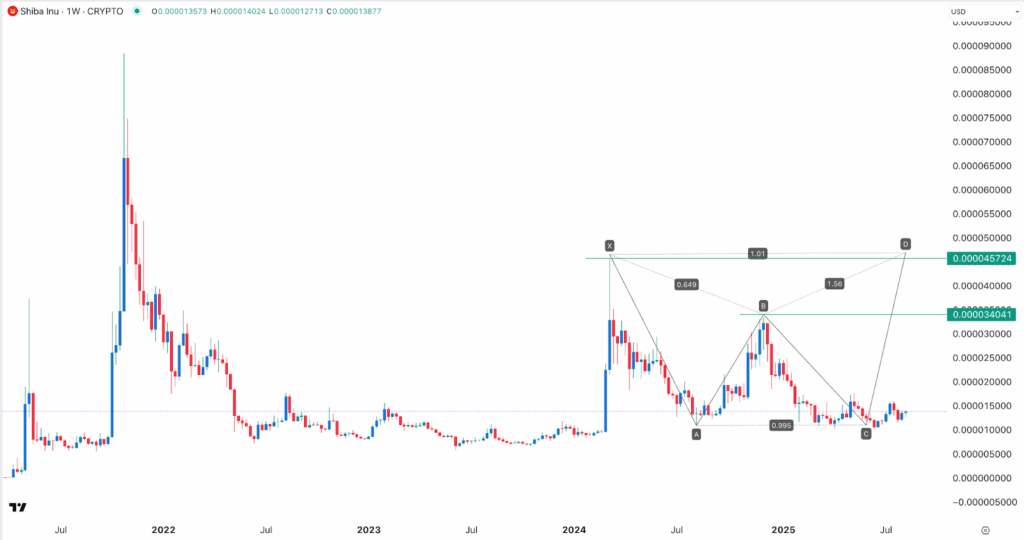
In this case, the bullish Shiba Inu price forecast will become invalid if it moves below the year-to-date low of $0.00001027. Falling below that level will point to more downside.
Wyckoff Theory Points to More SHIB Surge
The other bullish catalyst for Shiba Inu price is known as the Wyckoff Theory. Proposed over 90 years ago, this theory identifies the key stages that assets go through: accumulation, markup, distribution, and markdown.
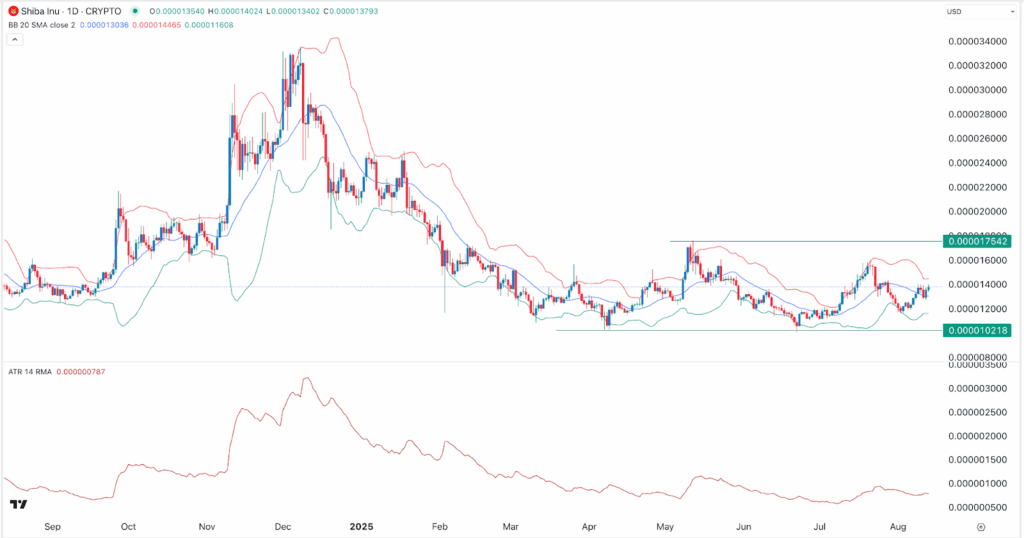
Shiba Inu is now in the accumulation phase, which is characterized with sideways price movement and little volatility. It also has low volume, signaling that smart money investors are slowly buying.
The weekly chart below confirms that the coin has been moving sideways and has low volatility. The low volatility is evidenced by the spread between the three lines of the Bollinger Bands has narrowed. Also, the Average True Range (ATR) indicator has continued falling.
Therefore, if the Wyckoff Theory works out well, it means that SHIB price will enter the second phase known as markup. The markup phase is characterized by higher demand and parabolic moves.
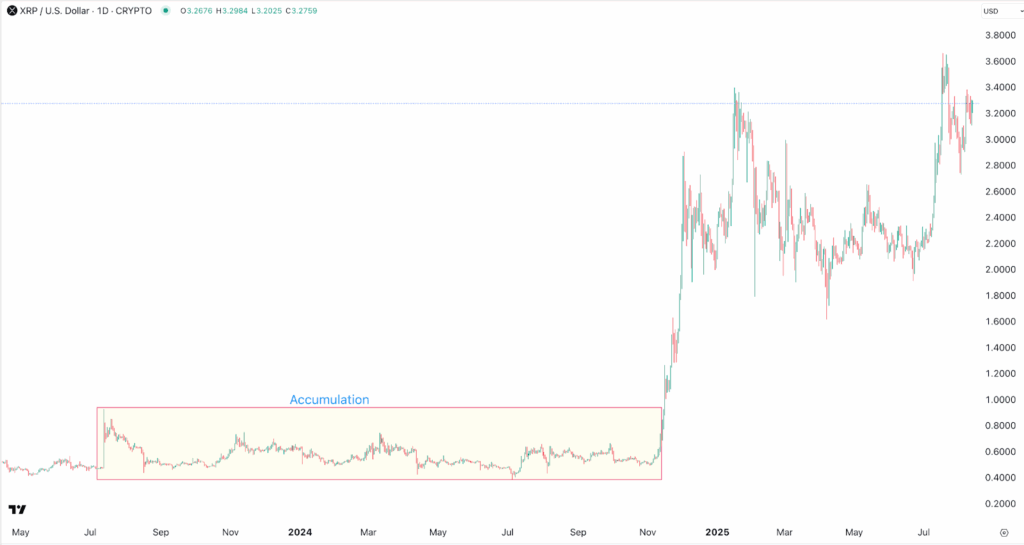
A good example of how the Wyckoff Theory works is in the XRP price chart below. This chart shows that the XRP token was in a deep consolidation phase for many months last year. This period was characterized by low volume and sideways price movements.
The accumulation phase ended in November last year when it moved into the markup phase, leading to a 500% surge within a few weeks.
Shiba Inu price has been under pressure this year as demand waned. Its daily trading volume has dried, while whale activity has been subdued, likely as these investors focus on other popular meme coins like Pudgy Penguins and Fartcoin.
However, the XABCD and Wyckoff Theory point to more gains in the coming weeks. One potential catalyst for this will be the surging Ethereum price, which is nearing its all-time high today.
Shiba Inu is the biggest meme coin in the Ethereum network, meaning that demand for tokens in the ecosystem could jump. The other potential driver for the token is the ongoing burn rate, which has made it highly deflationary.
SHIB burn rate has jumped by 3,840% on Wednesday to over 85.9 million.




