
 NEAR Protocol
 Bitcoin
 Aerodrome Finance
 Pearl
Pearl Uniswap
 Quantus
 Pudgy Penguins

Adam Back, a renowned British cryptographer and Satoshi ally, has predicted a possible timeline for the potential Bitcoin cycle top. His projection is based on historical halving events that is known to drive Bitcoin price patterns.
While Back is optimistic about the future price movement of Bitcoin (BTC), the coin might see a potential short-term decline. Besides, the historical price trend in August does not look good for Bitcoin.
Adam Back Release Bitcoin Cycle Top Timeline
The Satoshi Nakamoto ally shared a top estimated timeline for the Bitcoin cycle with his followers on the social media platform X.
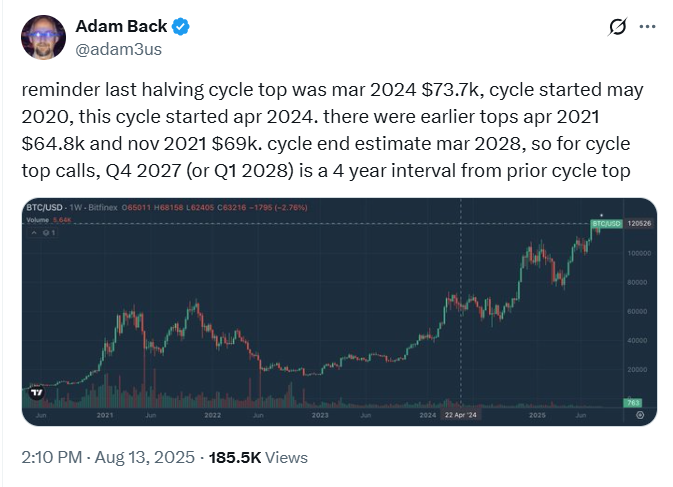
According to Back, the next Bitcoin cycle top would likely take place in Q4 2027 or Q1 2028. This timeline aligns with a 4-year cycle trend post Bitcoin halvings.
Back’s prediction aligns with historical patterns, where the peak typically occurs 12 to 18 months before the next halving.
To provide context, the Bitcoin cycle refers to a four-year pattern of price movement. This cycle revolves around the halving event that occurs every four years.
During halving events, miners’ block rewards are reduced by half. This reduces the supply of new coins that are issued through mining.
Before now, the price of BTC usually followed a unique pattern with halving in focus. It is marked by price peaks, followed by a bear market and eventual recovery in the next cycle.
In his post, Adam Back noted that the BTC price peaked at $73,700 in March 2024, ahead of the April halving. He pointed out that the cycle top began in May 2020 to April 2024, aligning with the 4-year trend.
Back further added that BTC price reached a high of $64,800 in April 2021, following the 2020 halving event. In November 2021, BTC hit another peak at $69,000.
If the 4-year halving trend holds this cycle, Back believes the BTC cycle top will come in either in Q4 2027 or Q1 2028.
Bitcoin Cycle Analysis and Trends to Watch
In line with the cycle, market data provider, Bitcoinsensus, predicted a short-term pullback for BTC. After the brief pullback, BTC is expected to see more price breakouts.
Bitcoinsensus described Bitcoin’s price movement in the current cycle as a staircase pattern. This is a common way to describe the price action of BTC during bull markets.
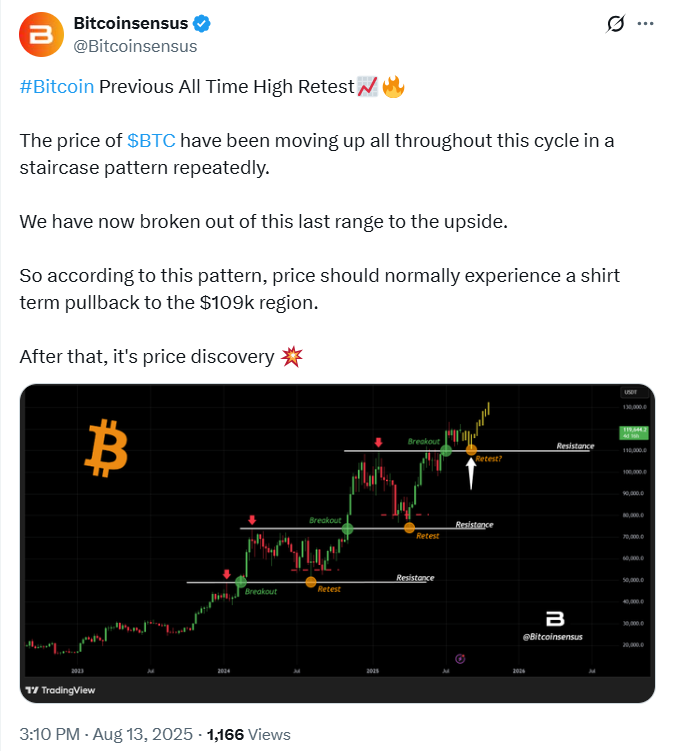
Typically, the staircase pattern involves periods of upward price movement followed by consolidations or downtrends, forming a step-like progression.
According to Bitcoinsensus, the Bitcoin price has broken out of the last range in the staircase pattern to the upside. Accordingly, price is expected to experience a short-term pullback to the $109,000 region.
Once BTC overcomes this level, the price is set to climb higher.
Bitcoin Historical Trends to Watch
As of this writing, the price of Bitcoin is hovering around $121,821, representing a 2% increase over the past 24 hours.
While Bitcoin showed a strong performance in the charts, the historical trends in August paint a bearish picture. In the past 14 years, Bitcoin has only closed August in the green five times.
The price has mostly been red for the other years, with losses often crossing into double-digit territory.
In August 2022, 2023, and 2024, BTC registered price declines of 14%, 11.2%, and 8.73%, respectively. According to Cryptorank, the median August return is negative, around -7.8%.
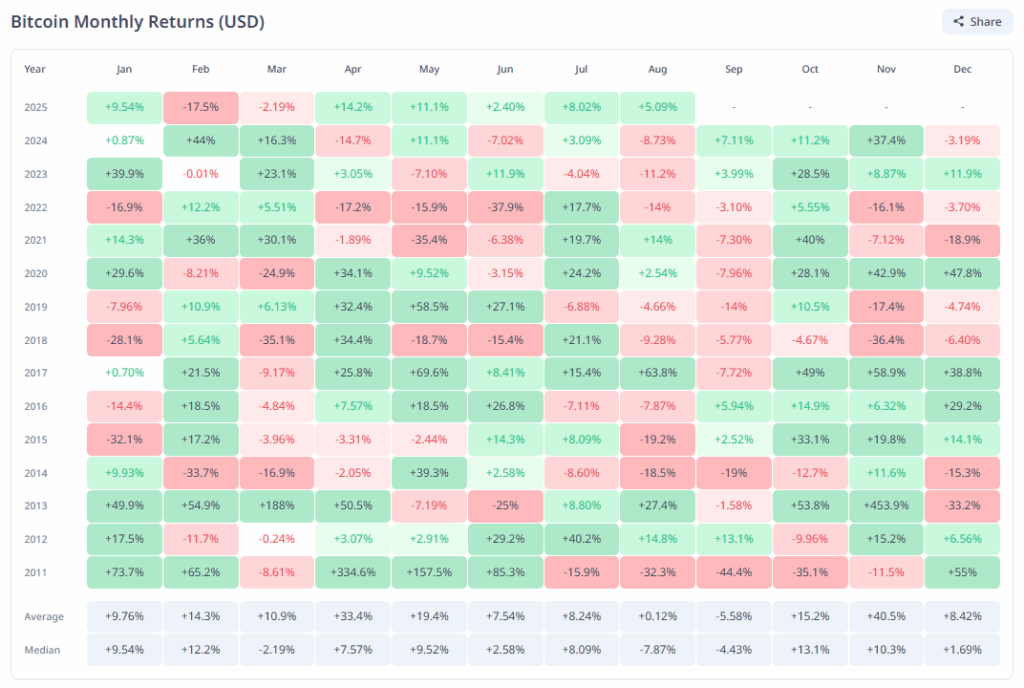
However, Bitcoin appears to be playing by different rules in August 2025. The price structure is gradually stabilizing after taking a hit in the second quarter (Q2) of 2025. In Q3, BTC registered a 13.5% gain.
So far this month, BTC has seen a 5.3% increase in its price. Moreover, Q4 is usually a busy quarter. Thus, BTC could break the August curse this year if the momentum continues.



