
 streamoors
 Altai the Tiger
 Sword Inu
 IGNITION
 no crying in the casino
 Quantus
 Pearl
Pearl
Key Insights:
- With a 5% price dip, Solana (SOL) has opened the path for a downside move.
- Looking at the current price action, an expert made a bold prediction that $160 could be SOL’s next target.
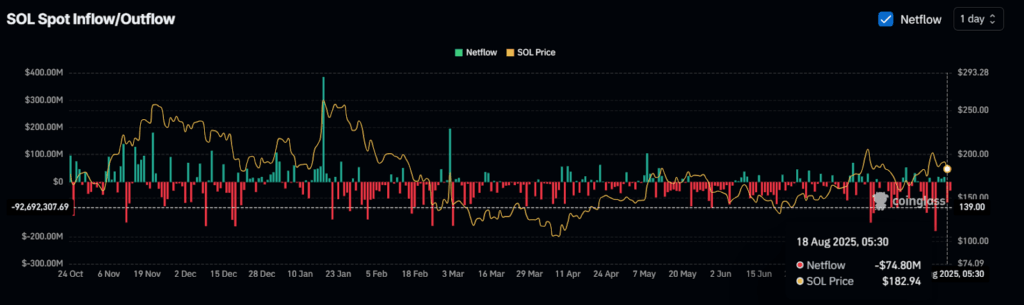
- Despite the bearish outlook, $75 million worth of SOL outflows from exchanges hint at ongoing accumulation.
It has been the second straight day, Solana (SOL) continues to decline and seems to be opening its path for further downside rally. Looking at the current market structure, investors, traders, and experts have shown a strong interest in the token.
Expert Bold Prediction and Current Price Momentum
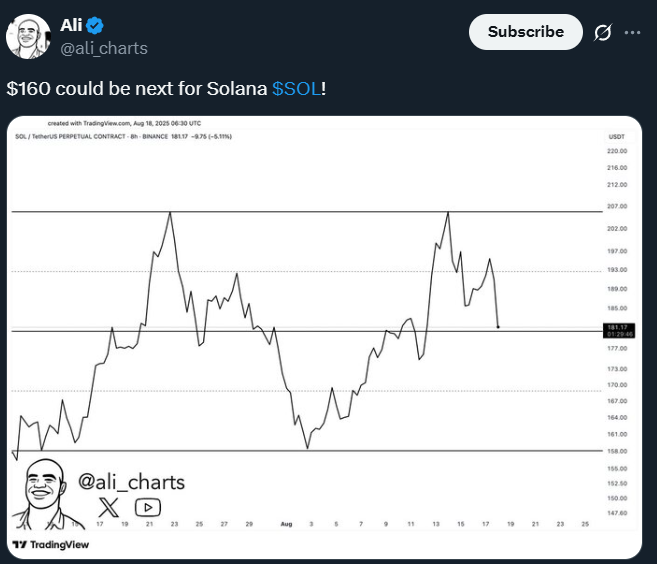
Recently, a prominent crypto expert shared a post on X (Formerly Twitter) where he made a bold prediction for Solana (SOL).
In the post, the expert shared that the next target for Solana (SOL) could be $160. This post on X gained widespread attention as it claims a 10% further dip from the current level.
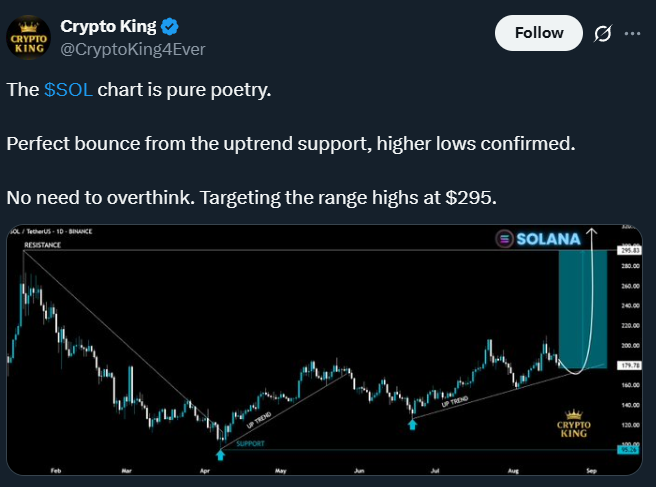
Another tweet by a well-followed crypto expert surfaced on X along with the SOL chart. In the post, the expert noted that SOL is in an uptrend and has been consistently taking support from an ascending trendline.
The expert added that SOL could bounce perfectly from the trendline. Furthermore, the post stated, “No need to overthink. Targeting the range highs at $295.”
At press time, the Solana price stands at $178.2 and has lost 1.25% over the past 24 hours. This mild drop in the asset has pushed it to a key support level; if it breaks, SOL could face a sharp fall.
Looking at this, investors and traders’ participation has plummeted notably, as the asset’s 24-hour trading volume dropped by 15% from the previous day.
Solana (SOL) Price Action and Technical Analysis
According to expert technical analysis, Solana (SOL) appears bearish and is poised for downside momentum. However, this outlook is based on a smaller time frame, whereas SOL is in an uptrend on higher period.
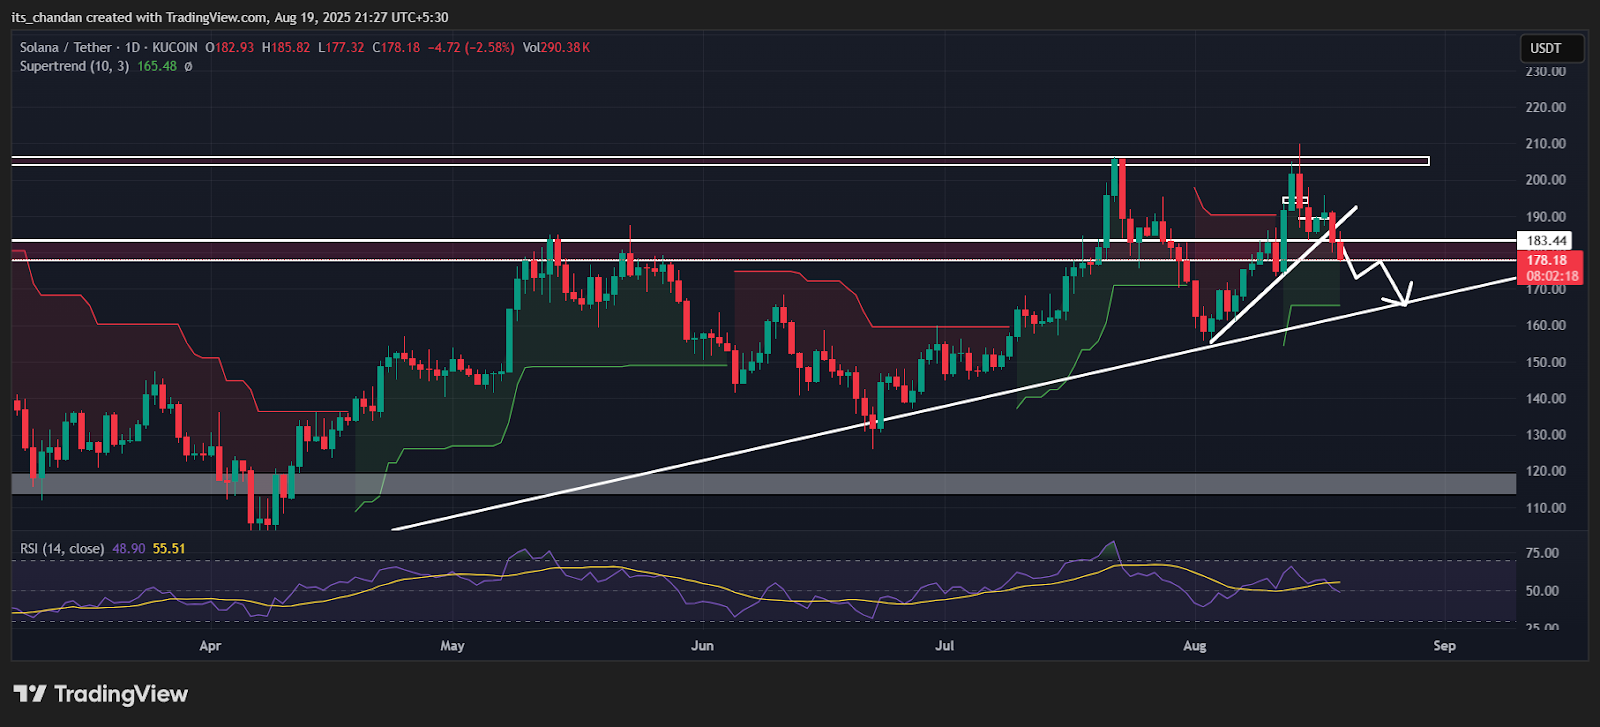
Given the current price action, SOL has broken its local support, which it has been getting from an ascending trendline, and appears to be heading toward another support, which it may get at $160 level.
Despite breaching local support, SOL’s technical indicator, Supertrend, is in green and trading below the asset price. It currently stands at $165, suggesting that the asset remains in an overall uptrend and that buyers are still in control.
Meanwhile, the Relative Strength Index (RSI) stands at 49, indicating neutral momentum, with market sentiment potentially pushing the asset in either direction.
On-Chain Metric Flashes Mixed Sentiment
Despite the price continuing to fall, investors’ and long-term holders’ interest in the asset has skyrocketed as they have begun seizing this dip by adding SOL.
Data from the on-chain analytics tool Coinglass reveals that over $106 million worth of SOL has been taken out of the exchanges over the past 48 hours. This substantial outflow of SOL from the exchanges hits ongoing accumulation as prices continue to fall.
Whereas traders, on the other hand, are following the current trend by strongly betting on the bearish side.
Data reveals that SOL’s major liquidation levels are at $175.8 on the lower side, which appears to be a support as bulls have built $118.05 million worth of long positions at this level. Meanwhile, traders have built $140 million worth of short positions at the $183.3 level, which appears to be a key resistance for the asset.
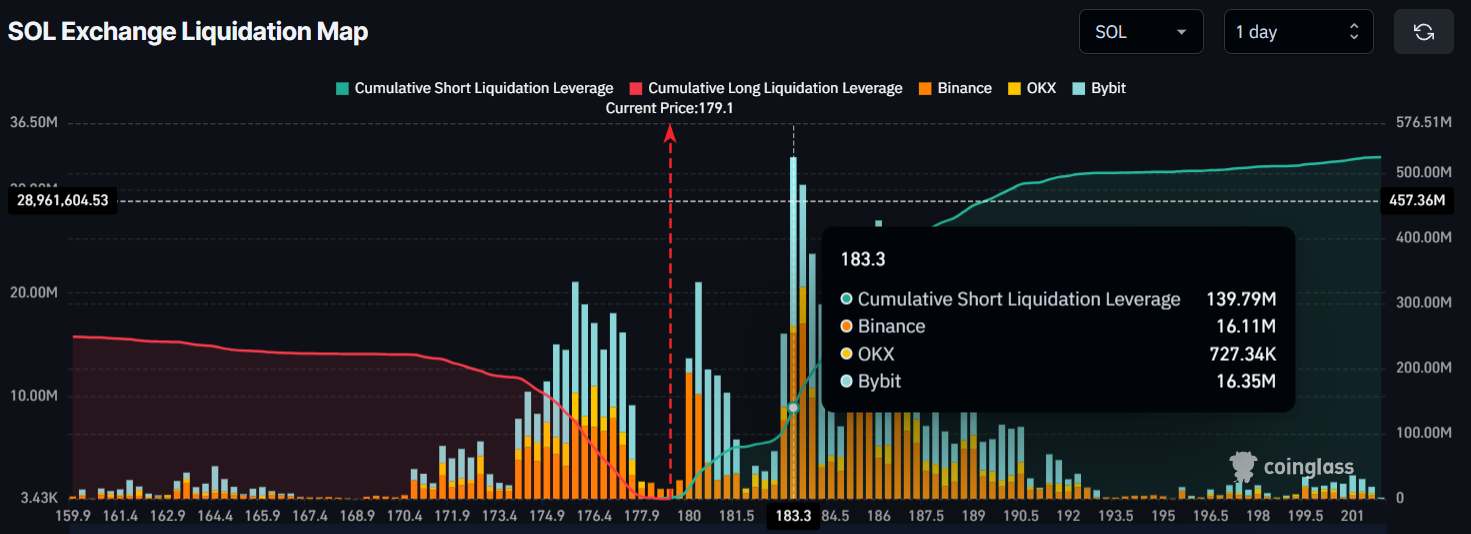
When combining these on-chain metrics with the technical analysis, long-term sentiment is still bullish, while short-term sentiment remains bearish.
Disclaimer
This article is for informational purposes only and provides no financial, investment, or other advice. The author or any people mentioned in this article are not responsible for any financial loss that may occur from investing in or trading. Please do your research before making any financial decisions.




