
 streamoors
 IGNITION
 Sui
Sui Quantus
 Bitcoin
 Pearl
Pearl Solana
Key Insights:
- Dogecoin price came out of a long-term trend of decline and has been performing a period of consolidation above the resistance points.
- Often, these Dogecoin rallies follow right after two red quarterly candles in a row.
- Technical targets suggest Dogecoin momentum could extend toward the $0.8 price zone if trend holds.
Dogecoin price joined a new stage of market activity due to its breakage of a long-term bearish pattern that had dominated its market performance since the year 2019. Over several years, the crypto moved down in a falling channel, establishing lower highs than lower lows, which means that there has been a lot of selling.
However, the memecoin pump above this pattern altered the technical picture with price action presenting a fresh impulse and positioning the asset to be able to make gains. Present consolidation above broken resistance is an indication of a change in sentiment.
Dogecoin Price Long-Term Downtrend and Structural Shift
From 2019 until late 2024, Dogecoin price moved within a declining channel, maintaining a series of lower peaks and troughs that confirmed extended bearish conditions. The structure remained intact despite periodic rebounds, suppressing the meme coin momentum.
A key accumulation phase occurred between mid-2020 and early 2021, which later fueled a sharp upward rally. That period demonstrated how consolidation zones often preceded explosive price movements in this market.
Following the 2021 rally, the broader market downturn pushed Dogecoin price into another multi-year decline. DOGE remained compressed within a larger falling channel, only to be disrupted recently when the asset retested the channel’s lower boundary and surged out with strong upward momentum.
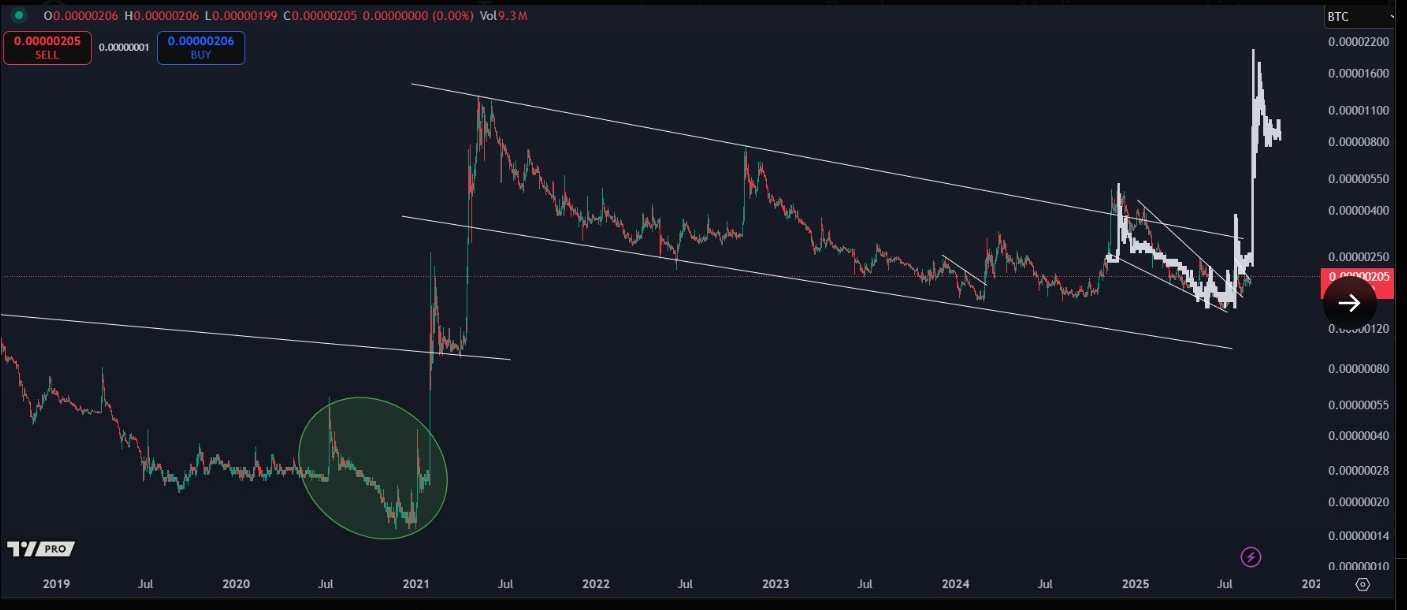
This move broke several resistance levels, signaling the first clear reversal in years. The sharp rally and subsequent consolidation above previous resistance points indicated a bullish cycle.
Symmetrical Triangle Breakout and Market Reaction
A symmetrical triangle formation has also shaped recent trading activity. The trend was established over a matter of months and DOGE reflected lower highs and higher lows. Breaks out of these patterns tend to yield sharp directional moves and the meme coin departure above the upper trendline has confirmed this characteristic.
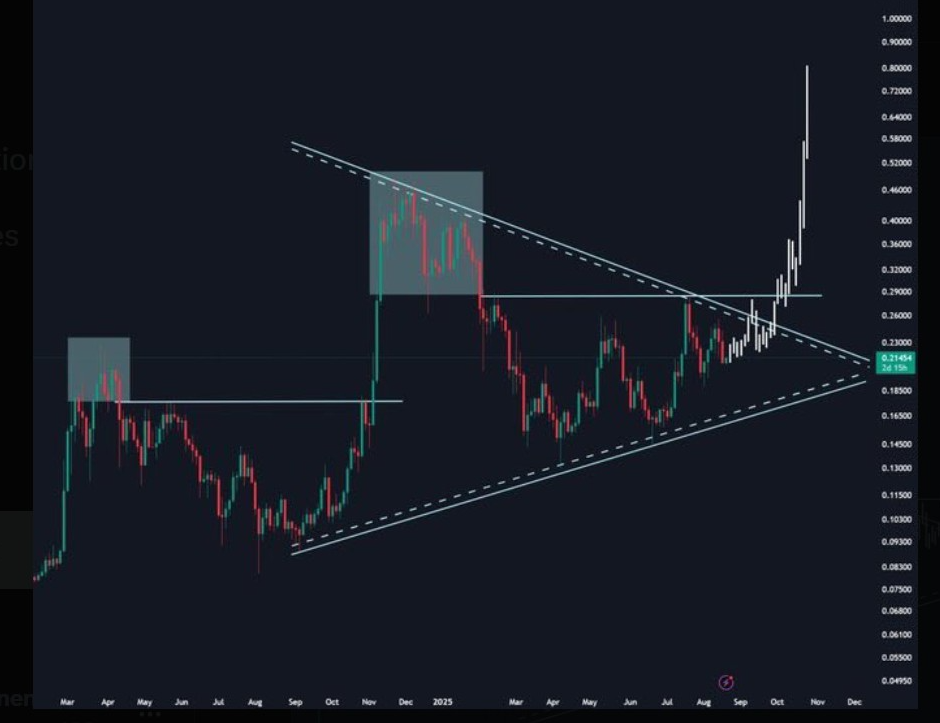
More so, the breakout lifted the price above the $0.32 mark, a zone that had acted as a resistance barrier in prior sessions. Historical analysis shows that sustained rallies have followed past breakouts from similar consolidation structures.
Technical projections from the breakout place the next price objectives between $0.50 and $0.80, with further extension possible if momentum remains. Analysts point to this as evidence that DOGE could be entering another expansion phase.
Recurring Quarterly Chart Structure
Besides the daily and weekly timeframes, Dogecoin price quarterly chart showed a repeating structure that has historically preceded huge rallies in the coin. The historical analysis revealed that whenever there were two red candles in a row in the three-month chart, there was quite likely a sharp turnaround.
Previous instances of this setup were associated with upward moves of 300% to 500%, establishing a cycle that traders have monitored closely.
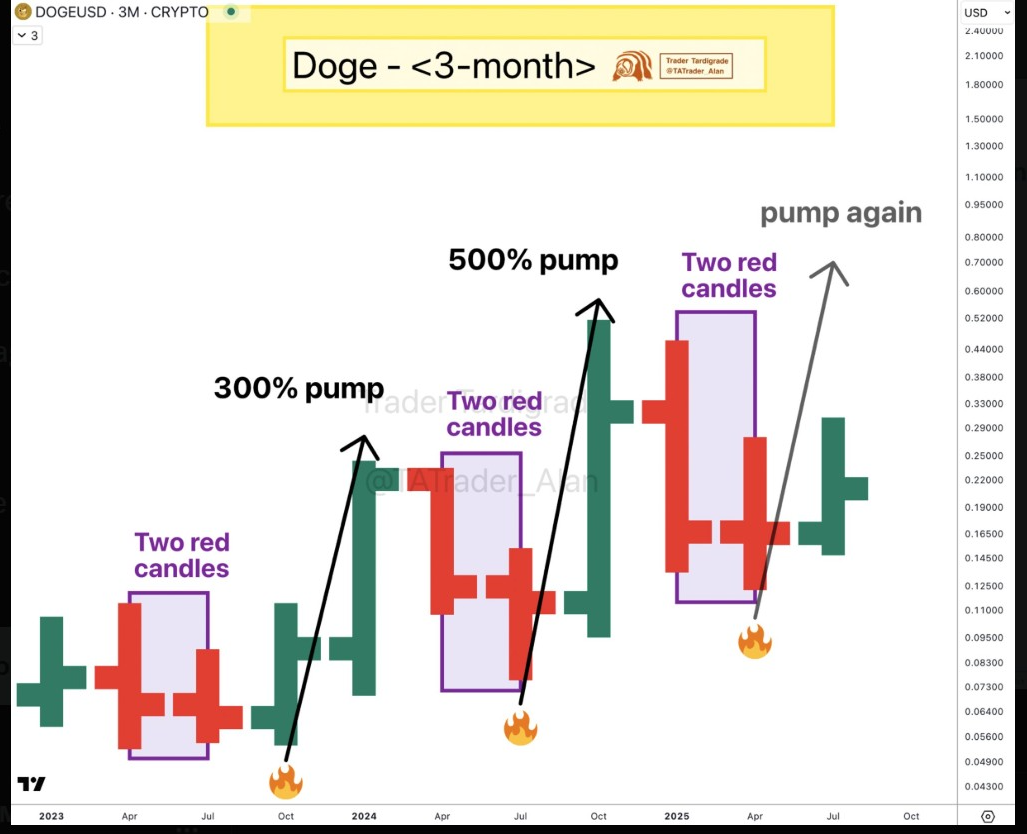
At present, the chart has once again printed two successive red candles. If the recurring structure remains consistent, the market could prepare for another substantial move to the upside.
Such cyclical trend previously acted as a turning point, marking transitions from prolonged declines to aggressive recoveries..
Outlook for Dogecoin Price
Dogecoin price has been consolidating on its previous resistance levels, and the current consolidation indicates that the key resistance is being defended, which gives hope of continuation. The breakout has changed the long-term outlook, with the sentiments now switching to positive on further improvements.
Based on the historical trend, the current consolidation may be preparing. The price to propel to near $0.80 in near term.
In the meantime, a different analyst stated that the most popular meme coin could reach the $1.4 level. In case a bullish construct holds. The short-term trend is supported by the escalating upward broadening wedge patterns, which denote improvement in the course of action.
Based on the price action, the breakout above $0.48 and later above $1 would validate the argument of prolonged gain.
Disclaimer
This article is for informational purposes only and provides no financial, investment, or other advice. The author or any people mentioned in this article are not responsible for any financial loss. That may occur from investing in or trading. Please do your research before making any financial decisions.



