
 streamoors
 Altai the Tiger
 Sword Inu
 IGNITION
 no crying in the casino
 Quantus
 Pearl
Pearl
The S&P 500 Index and its exchange-traded funds (ETFs) like Vanguard’s VOO and State Street’s SPY are in a strong bull market after soaring 40% from their lowest level in April this year. This article highlights some of the top reasons why the index and these ETFs have more upside this year.
Strong Earnings Growth Despite Donald Trump’s Tariffs
The first main catalyst for the S&P 500 Index is the potential for strong earnings in the third and fourth quarters.
Data compiled by FactSet shows that the index had an earnings growth of 11% in the second quarter, even after Trump implemented sweeping tariffs on all imports. This earnings growth was much higher than the expected 5%.
FactSet estimates that the third-quarter earnings growth will be 7.7%. If this is the final number, it will be the ninth consecutive quarter of earnings growth. In June, the estimate for the third quarter was 7.2%.
Chances are that the index will have a stronger growth rate than expected, which will help to support its performance.
Federal Reserve Interest Rate Cuts to Stimulate Rotation From Bonds
The other major catalyst for the S&P 500 Index will be the Federal Reserve, which has started cutting interest rates. It slashed them by 0.25% in the last meeting to between 4.00% and 4.25%, with the dot plot pointing to more cuts in the last two meetings of the year.
All signs are that the bank will deliver more cuts in 2026 as Trump finally replaces Jerome Powell as the Fed Chair with a will to cut rates further. Stephen Miran, whom Trump appointed last week, was the only official to vote for a 0.50% cut in last week’s meeting.
More interest rate cuts will likely lead lower bond yields, making fixed income less attractive as its spread with the headline and core inflation narrows.
Data shows over $7.4 trillion in assets in money market funds in the US. While some funds remain in these assets, others rotate the stock market. This explains why, historically, stocks have done well when the Fed turns dovish.
AI Tailwinds Still Remain
The recent gains in the S&P 500 Index have been because of the strength in the artificial intelligence industry, where hyperscalers like Amazon, Microsoft, Google, and Meta Platforms are spending billions of dollars in data centres.
This spending has helped to transform Nvidia into a $4 trillion juggernaut and the biggest company in the index.
There are signs that the AI industry growth is continuing after Nvidia and OpenAI announced a major $100 billion data center deal.
More companies have also announced major deals, such as Microsoft’s $17 billion data center partnership with Nebius, and recent results by Oracle that revealed a backlog of over $455 billion.
S&P 500 Index Technical Analysis Points to More Gains
The daily timeframe chart shows that the S&P 500 Index has been in a strong uptrend in the past few months, moving from a low of $4,816 in April to $6,693 today.
It recently moved above the important resistance level at $6,155, its highest on February 19. Soaring above that barrier invalidated the double-top pattern forming, whose neckline was at $4,816.
The index has remained above the 50-day and 200-day Exponential Moving Averages (EMA).
Also, the Relative Strength Index has moved to the overbought level at 74, while the Average Directional Index has jumped to 28. These indicators mean the index has more momentum, pushing it higher this year.
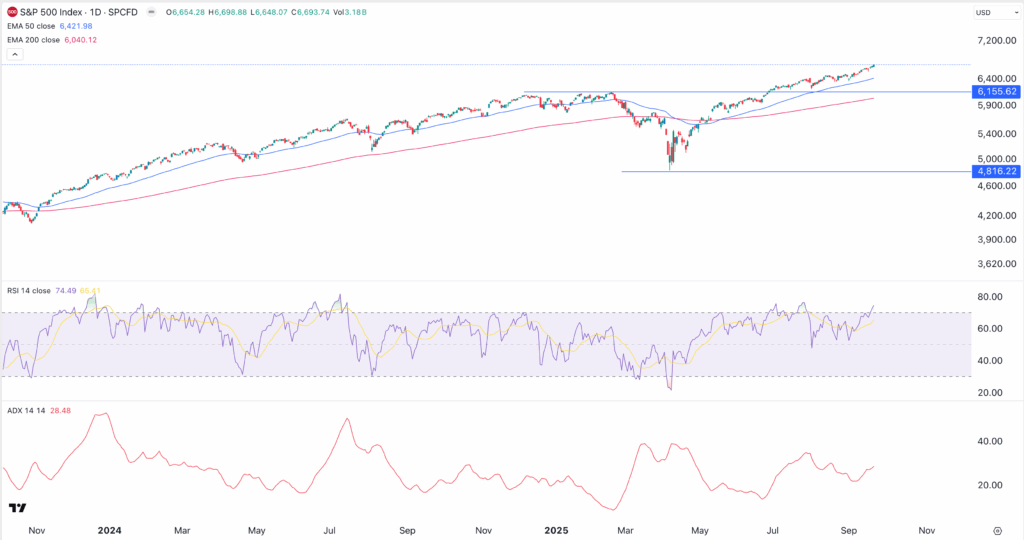
Therefore, the likely scenario is where the S&P 500 Index continues to rise, potentially reaching a high of $7,000, about 5.2% above the current level.




