Dacity Coin
 Bitcoin
 Pearl
Pearl NEAR Protocol
 Quantus
 Bittensor
 Pudgy Penguins

Market analyst John Bollinger, the creator of the Bollinger Bands, says Ethereum and Solana may be forming “W” bottoms. This is a sign that both coins could be nearing a price floor.
His comment comes as traders watch key support and resistance levels in mid-October 2025.
Bollinger’s View on Market Setup
John Bollinger, known for developing the Bollinger Bands indicator, shared on X that he sees possible “W” bottom patterns forming in the Ethereum (ETHUSD) and Solana (SOLUSD) charts.
He noted that Bitcoin (BTCUSD) does not yet show the same sign of reversal. The “W” bottom pattern often appears when a market tries to recover after a drop. Prices may have reached a support zone before moving higher.
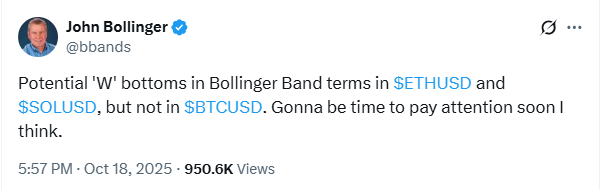
It suggests prices may have reached a support zone before moving higher.
Bollinger’s view has drawn attention because traders widely use his indicator to measure volatility and spot turning points in prices.
With the altcoin rally set to begin, Ethereum has shown a steady recovery in recent days. The coin rose by more than 15% after touching a low of nearly $3,435 and is now trading above $3,900.
Notably, analysts say the coin is trading inside a bull flag pattern, a sign of price consolidation within an uptrend.
This pattern began after ETH moved from its April low, near $2,500, to a high of approximately $4,950 in August.
If Ethereum breaks above the upper side of this flag, analysts believe it could move toward $4,450 to $4,500.
However, if it fails to cross the $4,000 level, a pullback could follow before another upward move.
Ethereum Price’s Key Levels and Market Signals
Ethereum’s 200-day Exponential Moving Average (EMA) sits close to the $3,500 zone, which has served as long-term support during past rallies.
So far, the ETH price has managed to stay above that range, giving traders some confidence that the coin is holding its ground.
On-chain data also supports this view. The Market Value to Realized Value (MVRV) model shows Ethereum price is trading near its average band around $3,900.
In previous cycles, this level acted as a base for further growth.
Similar moves were seen in early 2021, mid-2023, and early 2024, when prices rose after touching that range.
Some analysts, including Luca and FOUR, expect ETH to reach $4,500 in the short term if it continues to trade above its key support level.
FOUR also noted a neckline resistance around $4,750 that may come into play once the 4,500 level is crossed.
However, the market needs stronger trading volume and steady closes above resistance zones to confirm any lasting upward move.
At this point, ETH is going through a healthy correction within a larger uptrend, rather than a full reversal.
Market observers believe the next few weeks will be important in showing whether the current pattern will lead to a stronger rally.
Solana Holds Support While Traders Watch $200 Zone
Solana (SOLUSD) is showing similar chart behavior. The token is currently priced around $184, according to TradingView data.
Analyst HODL Gentleman noted that the main support areas are around $170 and $160. If the price falls below these points, it could lead to a deeper correction.
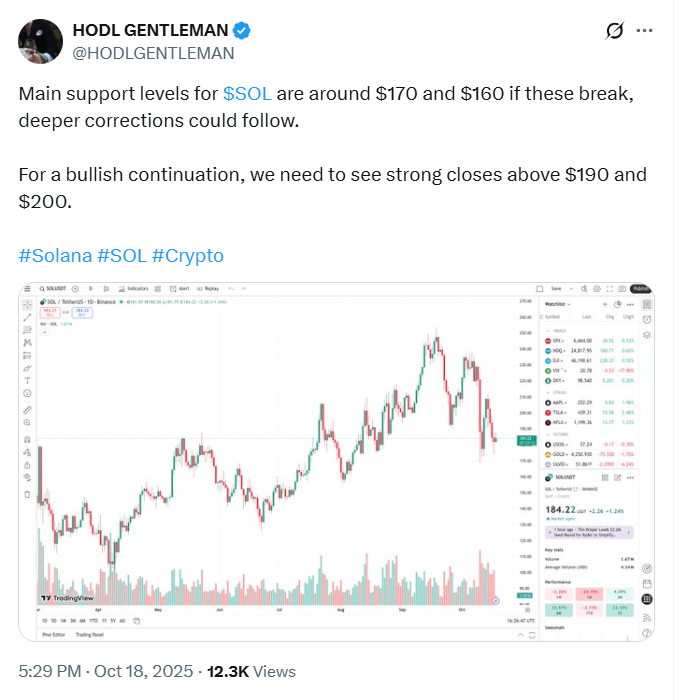
For buyers, the focus is on the $190 and $200 levels. A daily close above these levels would signal renewed strength and extend the current uptrend.
However, the market remains cautious until stronger buying pressure appears.
John Bollinger’s comments suggest that both Ethereum and Solana prices may be forming bases for a new round of growth.
Whether this happens depends on how each coin performs around its key support and resistance levels in the coming weeks.
Traders are now paying close attention to price movements as they look for clear confirmation of a bottom in both assets.