
 Altai the Tiger
 Sword Inu
 streamoors
 IGNITION
 NEAR Protocol
 Pearl
Pearl Injective

Ethereum price is consolidating around $4,500. It is similar to the historical breakout pattern of gold before a major rally. Analysts expect the top altcoin to follow a similar path. A long-term rally could be on the horizon.
ETH price might reach as high as $15,000. Strong ETF inflows and renewed institutional activity are now fueling optimism for another bullish phase in Ethereum‘s market structure.
Ethereum Price Faces $4,750 Resistance.
Market analyst Ted stated that the Ethereum price is consolidating around $4,500 and is ready to break out. He identified $4,750 as the next key resistance level. A close above it could push the ETH price toward $5,000.
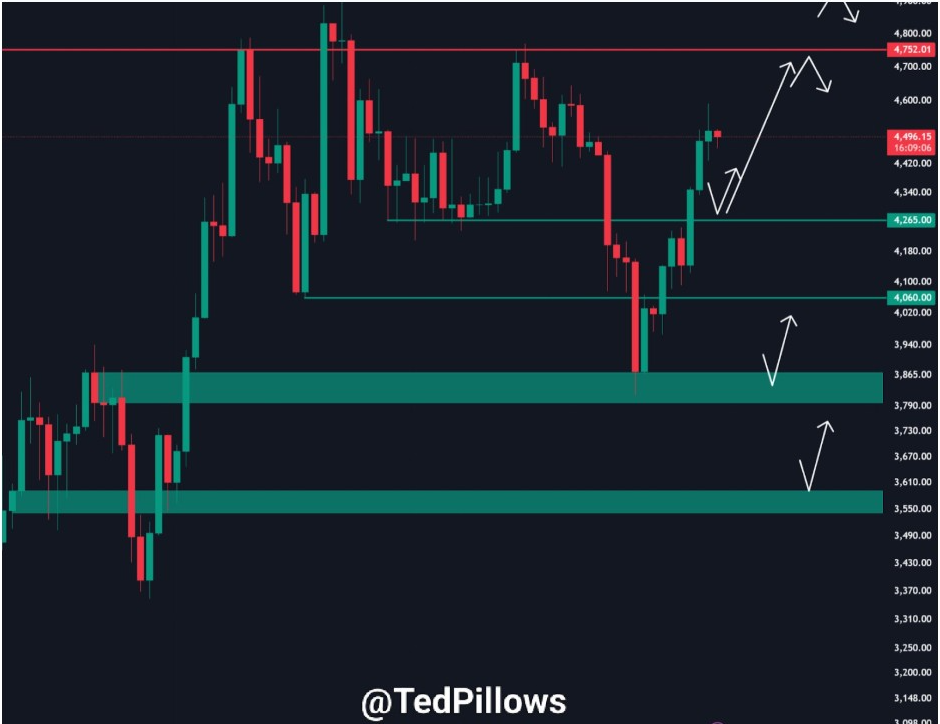
Ted emphasized the $4,100-$4,200 range is still a good support zone if short-term retracements occur. The daily structure reveals higher lows, which indicate steady accumulation by long-term holders.
His analysis indicated that ETH remains technically strong as long as the cryptocurrency stays above $4,550. Moreover, along with ETF inflows, trading volumes have also increased, suggesting the presence of new institutional investors.
Ted said a close above $4,750 signals bullish continuation. This could mark the beginning of the Ethereum price rally to $5,000.
ETF Inflows Surge to $1.2 Billion
Recent data from Ak47 showed that Ethereum spot ETFs are again receiving huge inflows. Between September 29 and October 3, however, ETFs saw more than $1.2 Billion in net inflows.
This is a positive indicator of investor confidence. The largest single-day inflow was on September 29 at $546.96 Million. It was followed by $307.05 Million on October 2.
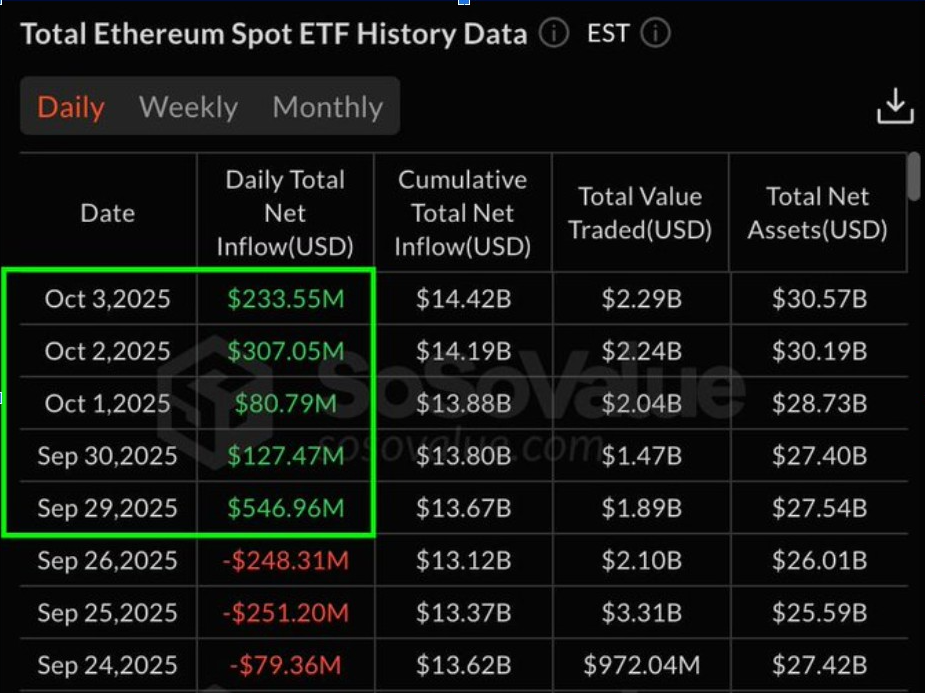
As a result, this wave of inflows brought Ethereum’s cumulative ETF net assets close to $28.7 Billion. This indicates that institutions are rebuilding their exposure.
Analysts believe this surge represented a new hope in the fundamentals and upgrades of Ethereum. Institutional buying has also helped stabilize the ETH price above $4,500, reinforcing the bullish setup.
Furthermore, steady ETF accumulation helped provide a strong price base before the next stage of the rally. ETH is drawing attention from large-scale buyers.
Price levels remain above $4,500. This establishes a solid foundation for sustained upward momentum. Ethereum price could soon aim for $5,000.
Gold Pattern Points to Ethereum Price hitting $15,000
Analyst Tracer added to the bullish outlook. He compared Ethereum’s recent moves to the multi-year rally pattern of gold.
His chart emphasised how the ETH price is following the breakout trend of gold after consolidating near $3,900. The comparison suggests that Ethereum could experience a similar surge once it breaks through the $5,000 mark.
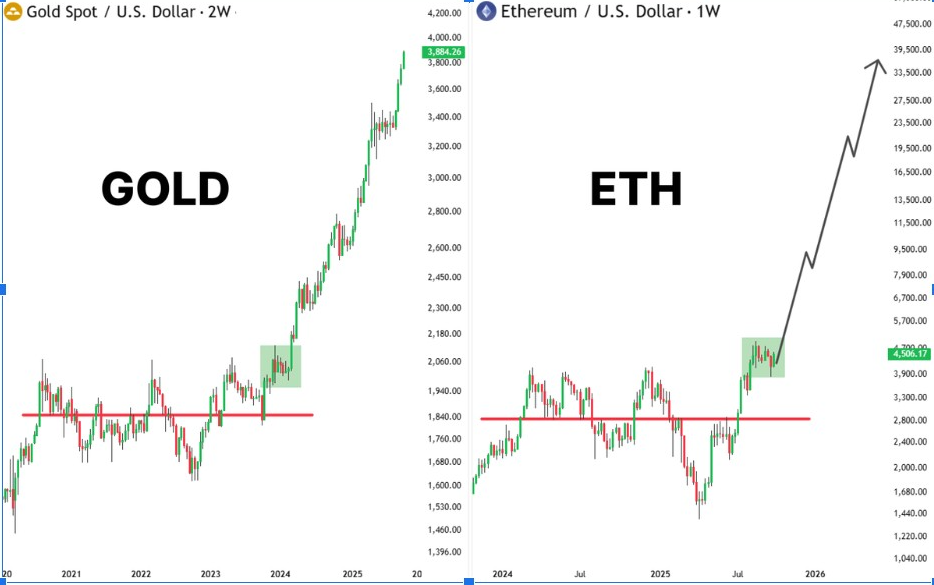
Tracer projected Ethereum could eventually reach $15,000 if the correlation holds up. Compare that to gold’s breakout from $1,800, which led to a more than 2x move.
He believes ETH is duplicating that path with the breakout base now formed near $4,000. The $5,000 level serves as a psychological threshold before acceleration. Tracer noted that the market trend around $4,000 resembles the early accumulation experienced by gold before its 2020 rally.
If momentum is maintained, though, the Ethereum price could see a long-term parabolic rise. This pattern adds positive strength to the picture of a prolonged bullish continuation throughout 2025.
Wyckoff Markup Phase for ETH Price
Meanwhile, analyst Trader Tardigrade predicted that the ETH price is in the Wyckoff reaccumulation markup phase. A prolonged rally often follows it.
His weekly chart showed that Ethereum finished its consolidation. Additionally, it is now entering phase E, the stage where prices rally.
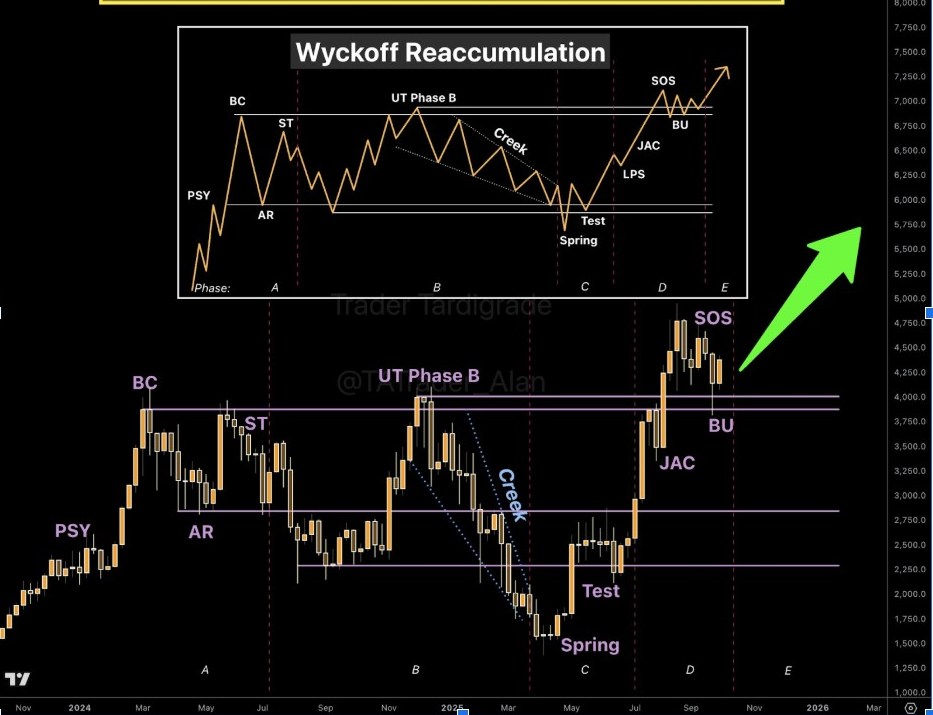
Tardigrade has already confirmed market strength with their “spring” and “test” phases of the pattern. This structure is bullish towards the $6,000 zone. He noted that rising ETF inflows support the Wyckoff thesis. Ethereum’s move fits the classic accumulation-to-markup pattern.
Historically, this formation signals the start of multi-month bull runs across major assets. If Ethereum price maintains its current setup, momentum could surge. Institutional inflows and rising derivatives activity may drive its most decisive move since early 2024.



