Pearl
Pearl Walrus
 Bitway
 Bitcoin
 Quantus
 Quant
Quant Pudgy Penguins

The IBIT ETF stock price suffered a harsh reversal this month, mirroring the performance of Bitcoin and other cryptocurrencies. The iShares Bitcoin Trust dropped to a low of $52, its lowest level since April this year. It is down by over 27% from its highest level this year. Meanwhile, IBIT reported outflows for the fifth straight day as of Tuesday; so, is this ETF a buy?
BlackRock’s IBIT ETF Outflows are Soaring
IBIT, the biggest and most profitable Bitcoin ETF, bled assets amid the ongoing crypto market crash slump.
Data compiled by SoSoValue shows that it had outflows in the last five consecutive days. It shed $523 million in assets on Tuesday, the biggest single-day drawdown this year.
Also, as the chart below shows, the fund has had outflows in the last four consecutive weeks, the longest streak since the fund was launched last year.
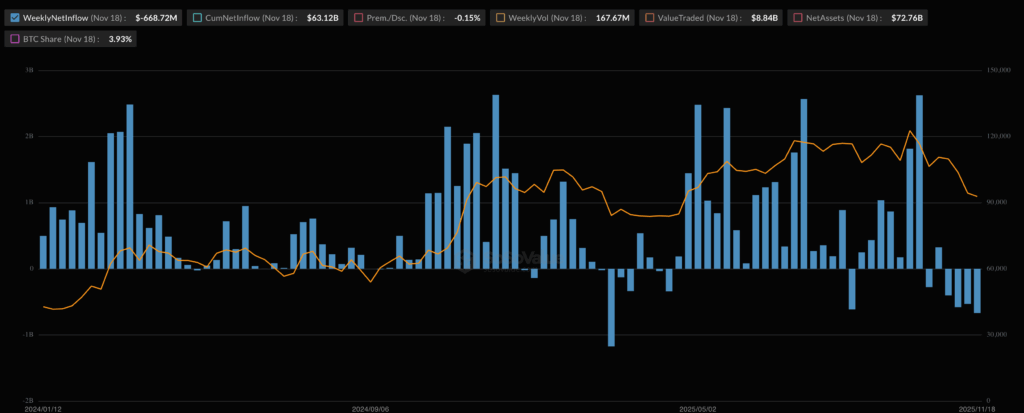
As of Wednesday, it had a cumulative inflow of $68 billion and $72 billion in AUM. This gives it the biggest market share in the industry by far, as all Bitcoin ETFs have $122 billion in AUM combined.
The ongoing IBIT outflows were reported amid Bitcoin’s price slump from its all-time high of $126,300 to ~$91,000 today. Bitcoin even moved below the important support level at $90,000 briefly earlier this week.
Bitcoin Price Has Potential Recovery Catalysts
A contrarian case can be made for Bitcoin and the IBIT ETF. First, this is not the first time that Bitcoin price has crashed in a bear market. Indeed, data shows that it was common for the coin to retreat after hitting a crucial resistance level.
For example, after jumping to $109,000 in January this year, Bitcoin plunged by 32% to a low of $74,700 in April. The coin then jumped to a new record high in May this year.
Another example is when Bitcoin dropped from $73,730 in March 2024 to a low of $48,900 in August last year. The coin rebounded and moved to a new record high. Therefore, if history repeats itself, there is a likelihood that the coin could jump to a new record high later this year or in early 2026.
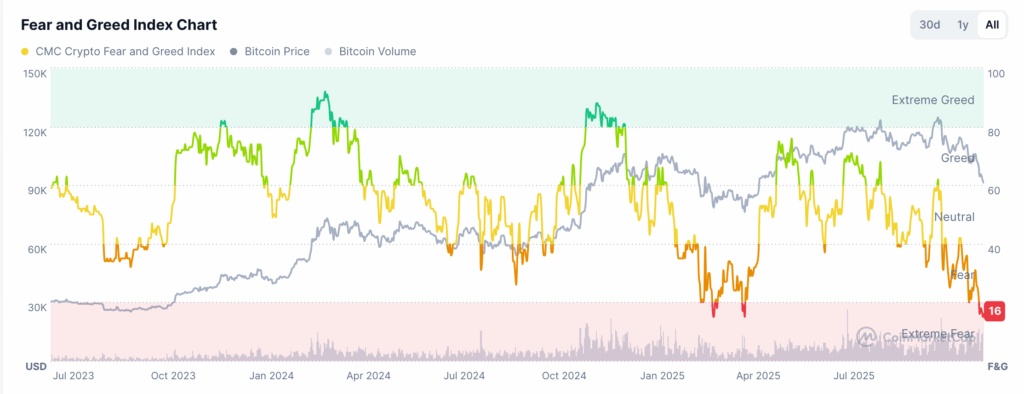
Another potential catalyst for Bitcoin is the fact that the crypto and the CNN Money Fear and Greed Indices have moved into the extreme fear zone. The Crypto Fear and Greed Index has moved to 16, while the other one plunged to 12, with all its sub-indices dropping to the extreme zone.
The chart below suggests that, typically, Bitcoin price rallies whenever the Crypto Fear and Greed Index has moved to the extremely fear zone. In most cases, crypto bear markets start when the gauge has moved to the green or extreme greed zone.
Additionally, technical indicators suggest that the Bitcoin price may start to rebound soon, now that it has moved to an oversold level. The Relative Strength Index (RSI) has dropped to the oversold level of 28, while other oscillators like the Stochastic Oscillator and Commodity Channel Index have all crossed the oversold level.
Most importantly, on-chain data indicate that large Bitcoin investors, commonly referred to as whales, were actively buying the dip. The most notable of these is Michael Saylor, whose Strategy bought Bitcoin worth over $835 million last week. Also, data shows that whales have accumulated 375k coins in the last 30 days after months of selling.
IBIT ETF Stock Price Analysis
The daily timeframe chart shows that the IBIT ETF stock price may be preparing for a potential rebound in the near term. For one, the Stochastic RSI indicator has moved to the oversold level of 3, while the Relative Strength Index is nearing the oversold level of 30.
The other bullish aspect is that the fund has already hit the target of the double-top pattern at $70 and the neckline at $60. This target was at $50, where it bottomed this week.
In summary, the current outlook of the IBIT ETF is dark as Bitcoin price drops and outflows jump. However, as mentioned above, there are a few bullish catalysts that could potentially push it higher in the coming days or weeks.