
 streamoors
 IGNITION
 Sui
Sui Quantus
 Bitcoin
 Pearl
Pearl Solana

The Uniswap price is regaining interest after reversing sharply on the long-term structural support. This is after an outflow of $67 million on Coinbase Institutional. 9,295,469 UNI worth $67,042,620 were transferred between the Coinbase and an unknown wallet.
The transfer is one of the biggest UNI-related transfers this quarter. The move could create an anxious mood in the market as the Uniswap price action is near critical chart levels. This also comes in line with a new debate on whether there can be a UNI burn proposal.
Long-Term Structure Holds as Uniswap Price Retests Ascending Support
Weekly Uniswap price charts reveal that market structure has been formed by a slowly upward support line since mid-2022, which the market has reacted to cleanly.
This soaring ground has led to various large-scale rallies in the past years. This was especially seen in July 2022, March 2023, October 2023, and June 2024.
The last response was in November 2025, when the Uniswap price momentarily dipped below the trendline and turned back up with a powerful weekly recovery candle. This response demonstrates that the multi-year model is not flawed, and it continues to influence market behavior.
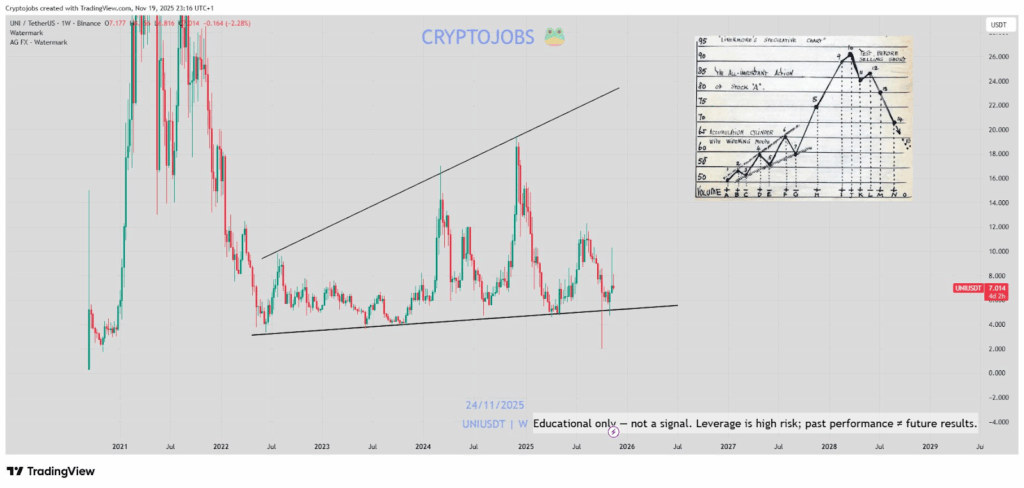
The weekly chart also indicates widening volatility between the line of support and the upper diagonal line, which stands at the highest points of mid-2021. The range has slowly expanded over a period of about three years.
The expansion reflects the initial steps of the Livermore accumulation scheme that can be seen in the first picture.
The schematic is mainly applied in the comparison of structures. Still, the constant testing of support, low rises, and broadening range by UNI are consistent with the first stages of the Livermore model. T
he support line has received more and more volume with each approach. We see a breakout in May 2024, January 2025, and this month itself. This indicates a continued involvement at these lower levels.
Uniswap Accumulating Under Strong Resistance
More Uniswap price charts show that bulls are accumulating directly under a big resistance band between $7.80 and $8.20. This tier has temporarily limited recovery efforts since the beginning of September. Rejections were made on September 8, October 1, and November 14.
Analysts observe that the sellers are in control so long as Uniswap is trading below this zone. This means that the market has not yet established that the short-term momentum has changed.
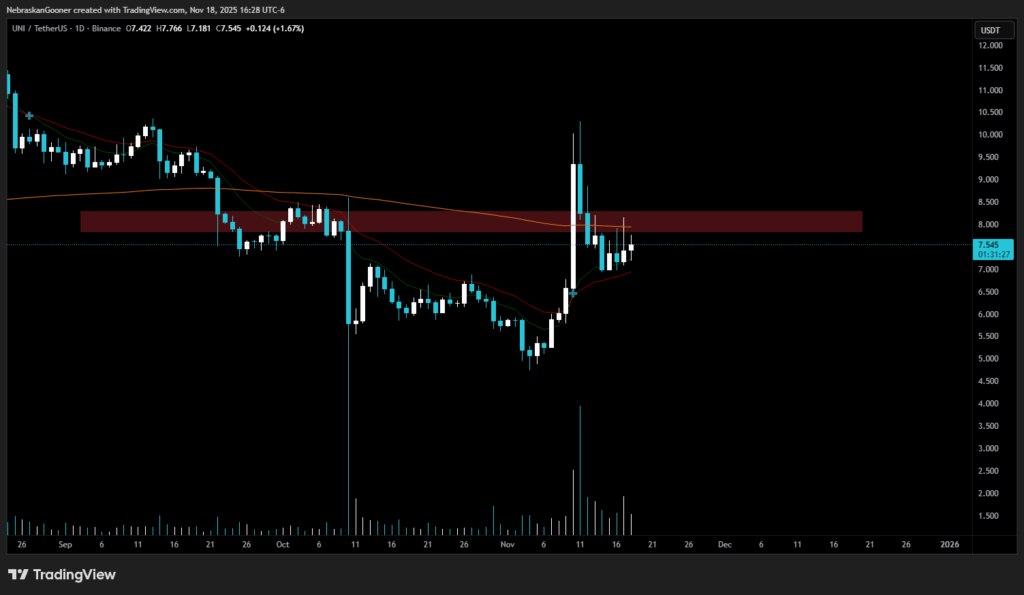
The daily chart has moving averages that provide more information. The 9-EMA and the 21-EMA may cross the price and are in the process of providing the short-term support. However, the 200-day EMA, which is located closer to the upper end of the resistance, is stronger.
This November spike of UNI to the $11 level formed a month-high wick. The Uniswap price rapidly rebounded to the resistance block. The steep wick highlights the existence of a sell pressure over the zone. It also highlights the need to assert continuity before any significant shift in the trend.
In the long term, the resistance equivalent of UNI is at the $12 to $15 level, which coincides with the 2024 highs. Until the Uniswap price approaches this zone, the token is in the structural compression phase, as proposed by the schematic.
The comparison is not a move to the future, but rather puts into perspective the long-term chart trend in reference to historical accumulation behavior.
Uniswap is at the lower point of a three-year structure that has served as a turnaround point several times. However, in the meantime, the exchange liquidity could still be constricted because of the institutional exit, which could slow down its next move.



