
 streamoors
 Sword Inu
 Altai the Tiger
 IGNITION
 no crying in the casino
 NEAR Protocol
 Pudgy Penguins
XRP price has been declining over recent weeks. With a significant wave of whale selling, the token price fell below $2.
Data from Ali Martinez shows that XRP price fell out of a local lower-high organization around the middle of November. The price later broke down below the $2.21-$2.03 zone on November 19.
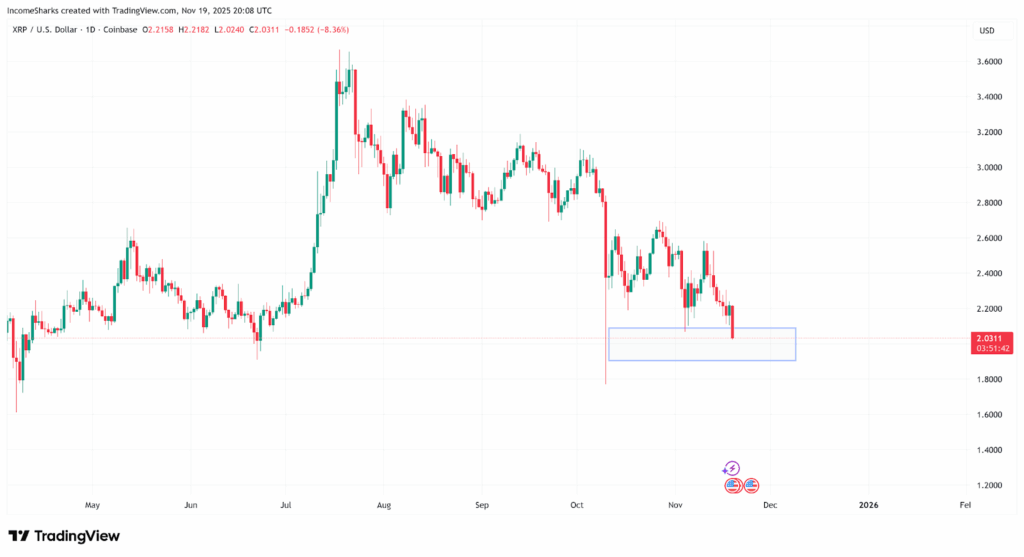
Numerous intraday candles have failed to reclaim the $2.20 area. XRP could now be vulnerable to further decline amid widespread distribution by market participants.
190 Million XRP Offloaded by Whales in 48 Hours, Will XRP Price React?
On-chain information indicates that whale wallets holding between 1 million and 10 million XRP tokens have sold approximately 190 million XRP over the past 48 hours. This decrease can primarily be attributed to the price decrease during the mid-October to mid-November period.
The supply of whales was greatest at the beginning of September. The numbers started a restricted decrease extending through October, and suddenly increased during the last week. This increase in sales has been reflected in the price chart by a correlated sequence of lower highs and steeper lower lows.
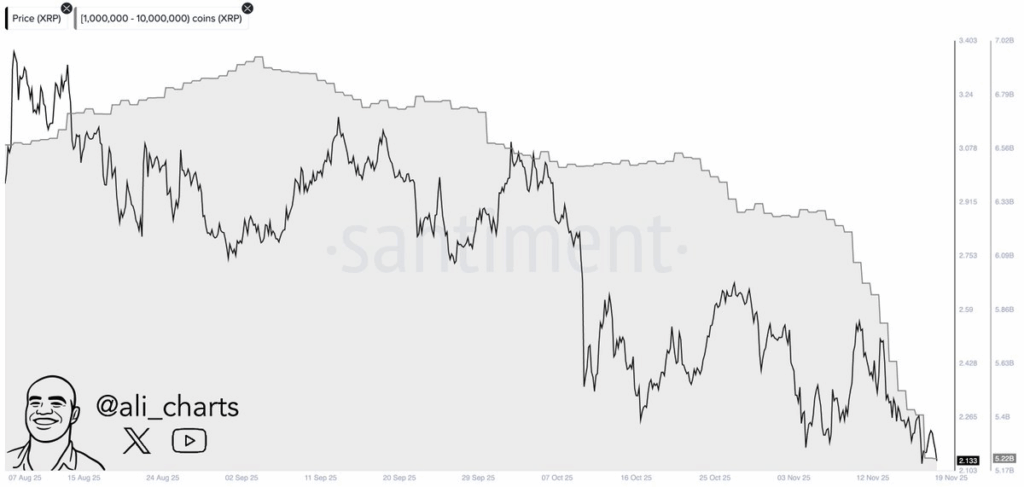
The coordinated fall of the whale balances aligns with the spot price, indicating that pressure on the supply side was key to the downward movement. This is seen particularly when XRP returned to levels not experienced since the start of summer.
The recent 190 million token decrease is one of the most condensed distribution windows since Q3.
XRP Price Confirms Lower Low as it Nears Key Support Range
Examining additional chart data, we observe that the XRP price has formed another lower low, this time below the previous one at $2.15. The chart shows a series of declining trend formations since September.
According to analysts, the move was not unusual in the current trend of falling highs. Moreover, the most recent touch below $2 confirmed the continuation of the trend.
The larger chart indicates that both attempts to rebound in the last four months have hit progressively lower levels. The first one reached $3.40 in early August, then dropped to about $2.70 in October and to about $2.50 in early November.
These consecutive breakdowns indicate a discernible downward trend. It has led XRP to the bottom of the $2-$1.88 support zone range.
By November 19, XRP price was approximately at the top of this multi-week demand area at $2.03. The zone refers to the 2021 high, as quoted in the macro structure, and it served as a pivot during the year’s sharp reversals.
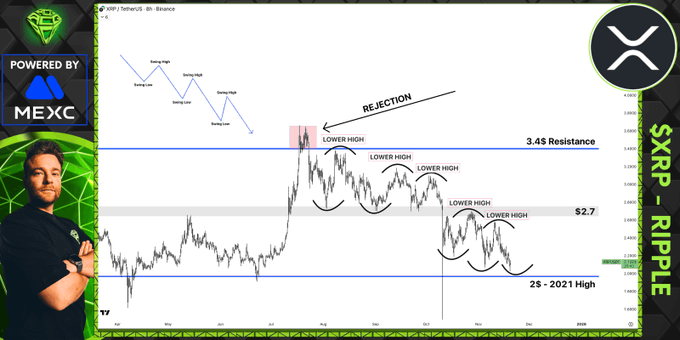
The analyst observed that the market is currently at a major support point. This implies that it is a technical level at which the XRP price has consistently reacted with quantifiable volume.
Retracement on the XRP dates back to the July increase, when the token briefly shot to the $3.60 zone. This was followed by a period of stable decline over a few months.
The price was losing support levels repeatedly, all the way into August and September, with lower swing highs on every new retest at major resistance levels. It was the structural break of October that fell below $2.70, which established the leg of the downtrend.
The November sequence depicts sellers dominating the daily candles, with the rejection being indicated by long upper wicks around $2.20. The inability to maintain bids at the middle of the range increased the fall towards the support box highlighted.
XRP price now tests levels last defended in early Q4, making this one of the most important structural ranges since XRP’s June recovery.



