
 Sword Inu
 no crying in the casino
 streamoors
 IGNITION
 Altai the Tiger
 Pearl
Pearl Quantus

Current Dogecoin price movements have hit a new TD Sequential buying signal on the three-day time frame. The indicator previously gave way to a steep recovery in July. Dogecoin price is now heading to a critical support area around $0.13.
The last buy signal, registered in late June, caused a pump from $0.143 to almost $0.288. This represented a 101.5% increase, one of the best multi-week rallies of 2024 by DOGE.
That recovery hit its peak in mid-July. After this, the momentum changed direction to a slow and multi-month decline.
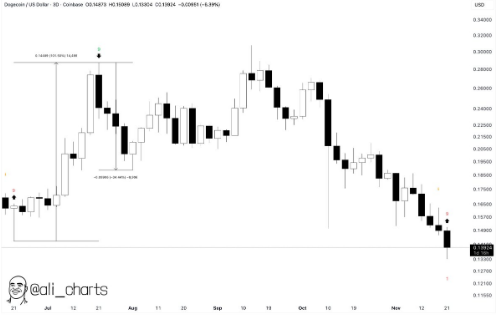
The TD Sequential buy signal appeared after a sharp 34.44% decline. This drop occurred between the swing highs of September and October.
The signal indicates a possible exhaustion after several lower highs and lower lows throughout late October and late November. The price at the time of the signal hovers near $0.139. This reflects the lowest three-day close since early summer.
A deeper analysis reveals that this signal formed at long-term structural support. The previous signal, however, emerged mid-range.
Dogecoin Price Holds Strong Weekly Support Near $0.13
Chart data shows the Dogecoin price is in touch with a multi-year rising trendline through the lows of 2021-2022 cycles. The trendline is a general upward structure. This links a minimum of four significant historical points of reaction over several years.
Dogecoin is currently trading above its weekly support level at $0.13. The chart data attests that DOGE has bounced off the same area numerous times, especially in early and late 2023.
The effect of these rebounds was multi-week recoveries. These recoveries saw an increase in market participation and an increase in spot trading volumes.
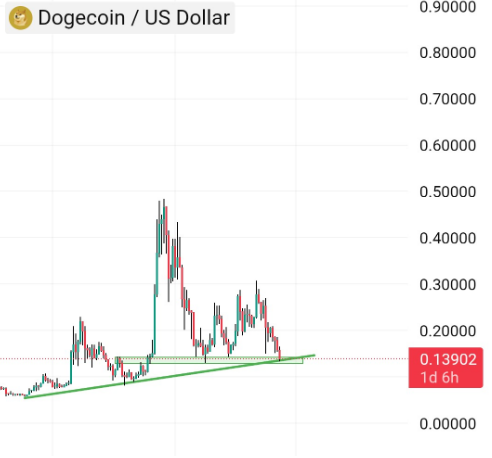
Failure to maintain the $0.13 zone could expose the next structural support near $0.09. This level is visible on the long-term chart as the lower boundary of the accumulation base formed during late 2022.
The chart currently does not show a breakdown. The Dogecoin price continues to trade within a multi-year ascending formation.
Dogecoin Price Structure Shows Wyckoff Accumulation on 3-Day Chart
Looking at more charts, we see the Dogecoin price action starting at the 2024 peak. This shows annotations of a multi-phase Wyckoff Accumulation schematic.
Analysts note that DOGE has spent nearly a year consolidating in this range. During this time, it progressed through Phase A, Phase B, and the Spring of Phase C. The chart depicts a strong downward liquidity probe towards the lower end of the horizontal range.
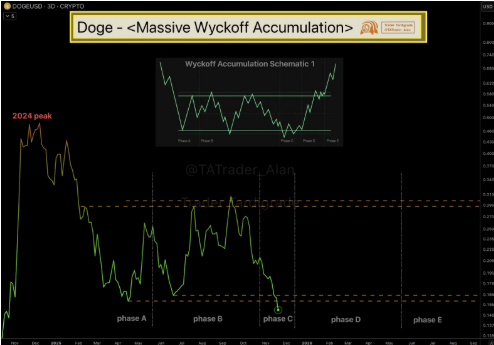
The Spring phase is a severe test of the demand. Additionally, the current three-day candle indicates that DOGE continues to trade within this region. Phase D, as noted by the analyst, would push the price back to the upper band of the range.
The move would also correlate with the resistance that is seen around the upper regions of the long-term chart. This includes 0.27-0.30. The last Phase, E, would be a breakout of the entire accumulation range.
The three‑day chart confirms a stable horizontal band. It shows repeated wick rejections at the top and recurring liquidity sweeps at the bottom. The accumulation structure is bounded by price movement between about $0.27 and 0.13.
The latest Dogecoin price movement is the lowest point in this pattern that has ever been tested. This only means that DOGE has bounced back to its most structural point since the beginning of 2024.



