
 streamoors
 Altai the Tiger
 Sword Inu
 IGNITION
 no crying in the casino
 Quantus
 Pearl
Pearl

XRP price is squeezed within a large market structure as traders await a move to occur. Compression signals continue to form as well as liquidity increases across key zones. Analysts are monitoring breakout levels and repeating patterns that could take XRP in the next rotation.
Macro Structure Holds With Rising Compression
EGRAG stated that the XRP/BTC macro structure remains intact and continues to compress. He pointed out a bullish pennant and symmetrical triangle forming on higher timeframes. These patterns usually build energy in advance of phases of rotation.
He explained that the downtrend channel is broken and support zones are respected. Fibonacci confluence was also used to support long-term targets. His first target is still close to 0.0000048 BTC and the second one is at around 0.00001300 BTC.
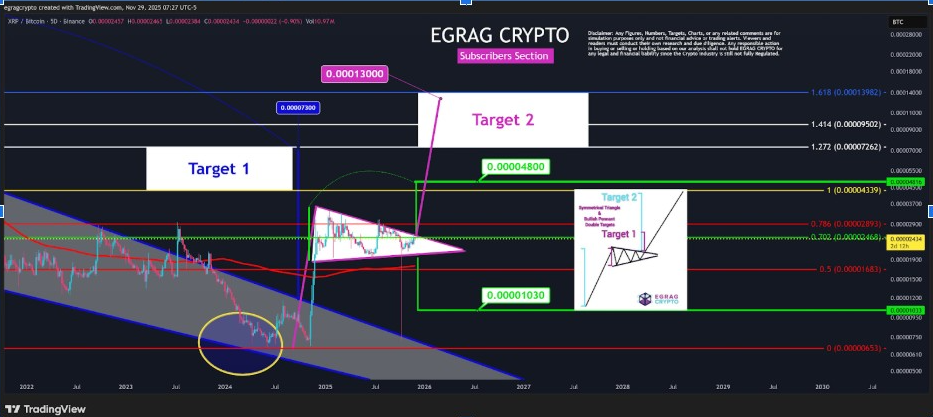
According to EGRAG, rotations usually start when the cooling of Bitcoin dominance occurs. He said XRP price has historically picked up pace during such cycles. His view provides the basis for understanding the higher timeframe scenario before switching to USD-based signals.
USD Levels Indicate Important Technical Thresholds
Furthermore, EGRAG also shared a USD chart with important Fibonacci thresholds. He noted that a close above $2.60 puts XRP above the Fib 0.5 level. A close above $3.40 will push price over the Fib 0.888 marker, which he called “super bullish.”
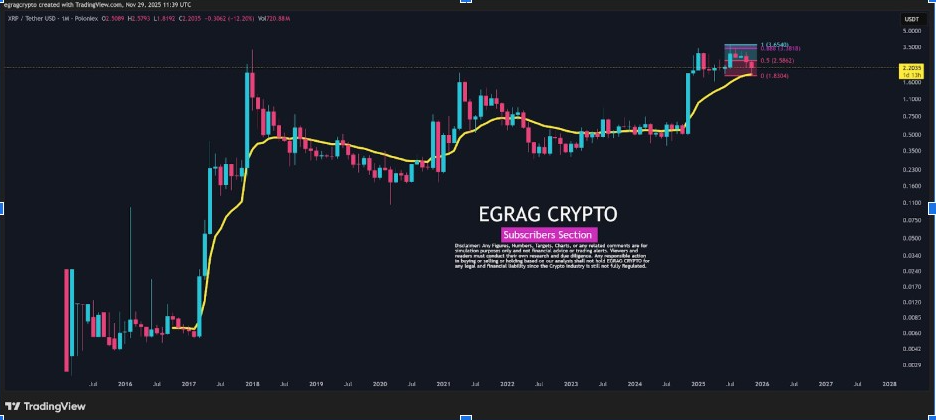
He warned the opposite scenario is possible. A close below the EMA at 21 months would be an indication of severe weakness. The monthly chart showed the price balancing above the yellow EMA while attempting an early reversal.
This USD outlook complements his previous BTC structure. Both emphasize key areas that characterize long-term trend direction.
Historical Patterns Resemble Previous Market Cycles
Similarly, Steph Is Crypto said XRP is repeating its pattern of 2017. His chart compared the 2017 liquidation wick to the current wick of 2025. Both exhibit deep rejection and then recovery inside the Gaussian Channel.
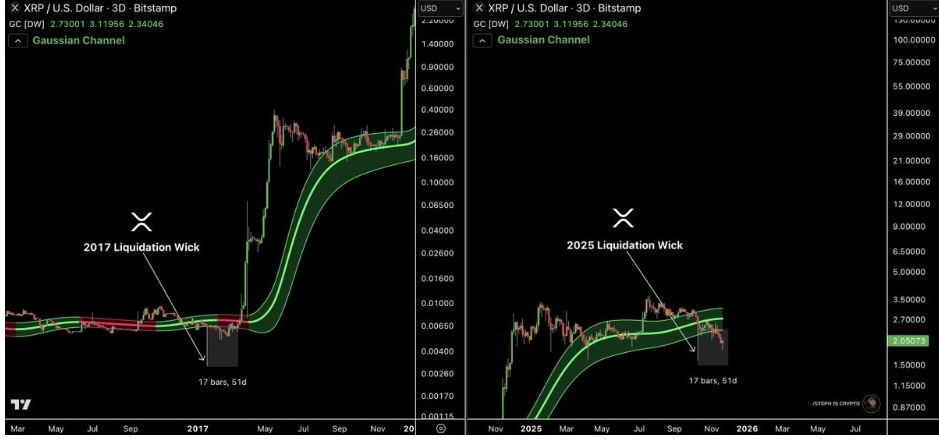
He noted that both of the events show the same timing: 17 bars and 51 days from wick to lift. This match supports his belief that long-term patterns may still be controlling the market behavior. He added that few believed the setup in 2017 until the breakout was already underway.
Short-Term Structure Works Toward Resistance
Marzell pointed to improving short-term structure as the Supertrend turns green. He showed the bullish flag forming above the 23.6% Fibonacci level. His next target is at 50% near $2.46 with potential towards $3.
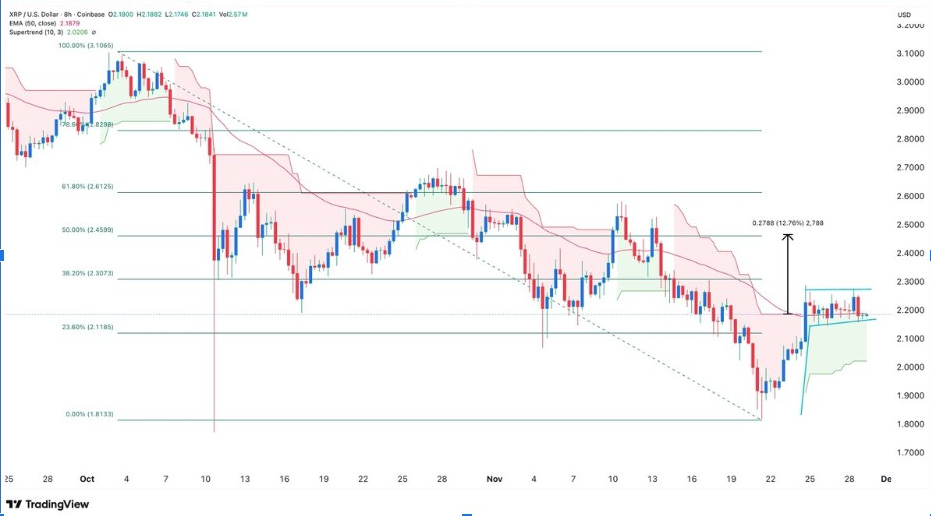
He also noted increasing ETF inflows and rising transaction volume. These shifts indicate increasing participation amid slow momentum. His chart illustrated price stabilizing at a higher level of $2.18 plus and forming a tight consolidation range.
FOUR said XRP price is also holding its ascending trendline on the 4-hour chart. He pointed out two nice higher lows and regular demand responses. His zone of resistance is at $2.55-$2.60, which is consistent with Marzell’s first targets. FOUR expects a test of this zone if trendline strength continues.



