
 Zylo Ecosystem
 Walrus
 Bitcoin
 Sui
Sui Quantus
 Quant
Quant Starknet

Solana price movement caught attention as the altcoin continued its decline. It has now approached the lower band of its current trading structure.
The move comes amid growing caution across the crypto market. With this, traders are monitoring whether the token will stabilize after several sessions of downward pressure.
Analysts observing short-term and long-term technical patterns indicate that the next critical pricing area sits around $124.
SOL price retreats from near-term resistance levels. Traders fail to generate sustained buying interest. Brief recovery attempts quickly lose momentum.
Solana Price Short-Term Technical View
Market analyst Ali Martinez reported that the Solana price is approaching a level around $124. It has acted as a stabilizing area in previous corrective phases.
His one-hour chart indicated a breakdown below mid-range support at $134. This extended the sell-off that began earlier in the week. Sellers maintained control as SOL price action continued to move toward the lower boundary of the December structure.
Martinez’s model presents a projected path. This reflects potential weakness before any attempt to consolidate above the $124 threshold.
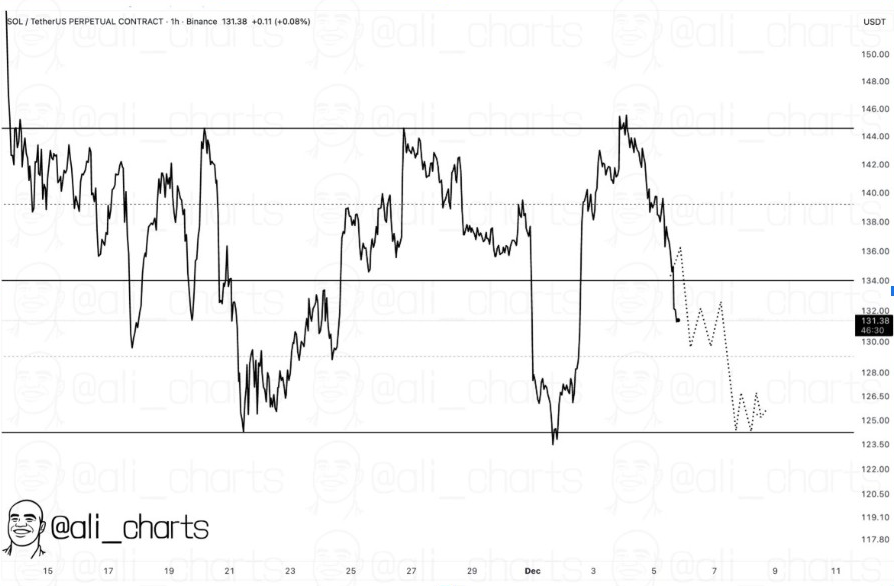
The chart shared by Martinez showed a pattern of lower highs. This reinforced the presence of short-term bearish momentum. Each attempt to reclaim higher levels was met with downward pressure. It’s a sign that investors may be waiting for more entry points.
The absence of recovery signals strengthens the case for Solana revisiting earlier liquidity zones. These zones mark areas where past accumulation previously took place.
Analysts note that if volatility remains elevated, the $124 area is an important reference point for assessing buyer interest.
Support Dynamics and Potential Stabilization Zone
Analysts observe that earlier movements around this level resulted in consolidation. This suggests that traders saw value there during earlier downturns.
The current approach to this zone again focuses on whether Solana’s price can achieve a similar form of stabilisation. Any sustained movement above this pricing area could indicate that sellers are losing momentum.
Downside volume increased in recent sessions, contributing to the movement toward support. If sellers continue to dominate, SOL price may face additional pressure. This could drive it toward secondary levels below $120.
However, analysts also note that sharp declines sometimes lead to technical pauses when the price reaches areas of interest. This type of stabilizing trend appeared in past cycles, making the $124 zone an important marker for the short-term outlook.
Descending Wedge of Solana Price: Key Structural Pivot at $128–$130
Another perspective comes from analyst Don, who reviewed Solana’s market structure using a high-timeframe descending wedge formation. His analysis places the token within a multi-month pattern defined by lower highs and repeated interactions with the lower trendline.
This structure outlines a narrowing price range that has guided Solana’s corrections since earlier in the year. Current Solana price action sits near the wedge floor. This aligns with the $128–$130 region and serves as a structural pivot for the broader trend.
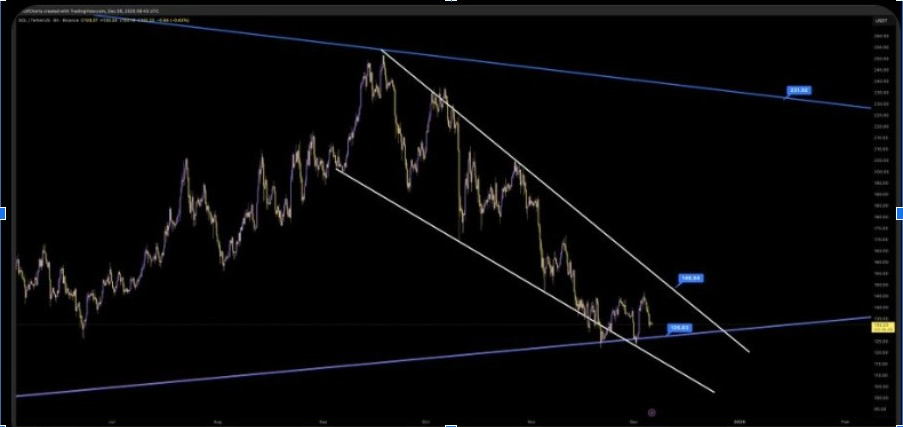
Don’s chart shows Solana price holding within its long-term formation. The setup keeps potential for upward movement if the lower trendline holds. The descending structure also identifies resistance levels that would need to be reclaimed before any sustained upside move can develop.
Current conditions reflect market caution. However, the wedge pattern continues to provide a framework that traders use to evaluate future movements and key decision areas.
The upper boundary of the wedge sits higher than current trading levels. This left room for a notable recovery if buyers regain strength. Analysts monitoring the pattern observe that the long-term trend remains intact as long as SOL price trades above the wedge floor.
A break below this level would alter the structure and introduce the risk of deeper retracement. The area around $124 and the lower wedge band draw focus. Traders watch to see if the Solana price stabilises or extends its decline.



