Doge Pepe
 Zylo Ecosystem
 Pearl
Pearl Bitway
 Optimism
 Quant
Quant Quantus

Bitcoin price remained trapped in a tight range as December progressed, frustrating both bulls and bears. On-chain data and market structure suggested the pause masked deeper distribution risks rather than healthy consolidation. Multiple analysts warned that recent stability did not reflect improving fundamentals.
At the time of writing, Bitcoin was trading near $88,000, exhibiting limited directional momentum over the past several weeks. The lack of follow-through followed a volatile year marked by sharp rallies and deep corrections. Market participants increasingly questioned whether the current phase resembled accumulation or early-stage distribution.
This question was important because historical Bitcoin bottoms rarely felt stable in real-time. Cycle lows often arrived during periods of extreme fear, not calm price action. Current data painted a more complex picture than simple capitulation narratives.
Bitcoin MVRV Signals Profit-Taking, Not Capitulation
Crypto analyst Rekt Capital said Bitcoin bottoms “never feel safe” during real-time formation. He pointed to the Market Value to Realized Value, or MVRV, percentile as a key cycle gauge. According to RugaResearch data, true capitulation historically occurred when MVRV dropped into the 0–10% zone.
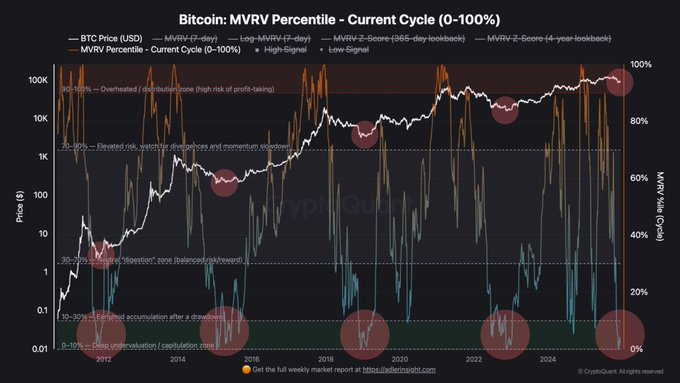
Bitcoin remained far above that threshold. RugaResearch noted that MVRV readings near 1.51 indicated widespread unrealized profits rather than systemic losses. Older holders appeared positioned to distribute, not accumulate, during the current range.
Historical comparisons reinforced this view. In 2015, Bitcoin traded near $200 amid concerns about the Mt. Gox collapse. In 2018–2019, prices hovered near $3,000 after the initial coin offering crash. In 2022–2023, Bitcoin bottomed around $15,000 following the FTX collapse.
Each phase shared intense fear, hostile narratives, and underwater holders. Current conditions lacked those characteristics, according to RugaResearch. The firm said accumulation zones only looked obvious in hindsight, not during periods of relative calm.
Exchange, Miner, and Whale Data Show Divergence
On-chain metrics from CryptoQuant suggested deeper structural stress beneath surface consolidation. Exchange reserves fell to 2.76 million Bitcoin, reducing immediate sell pressure. However, exchange inflows and outflows remained balanced, indicating limited aggressive accumulation.
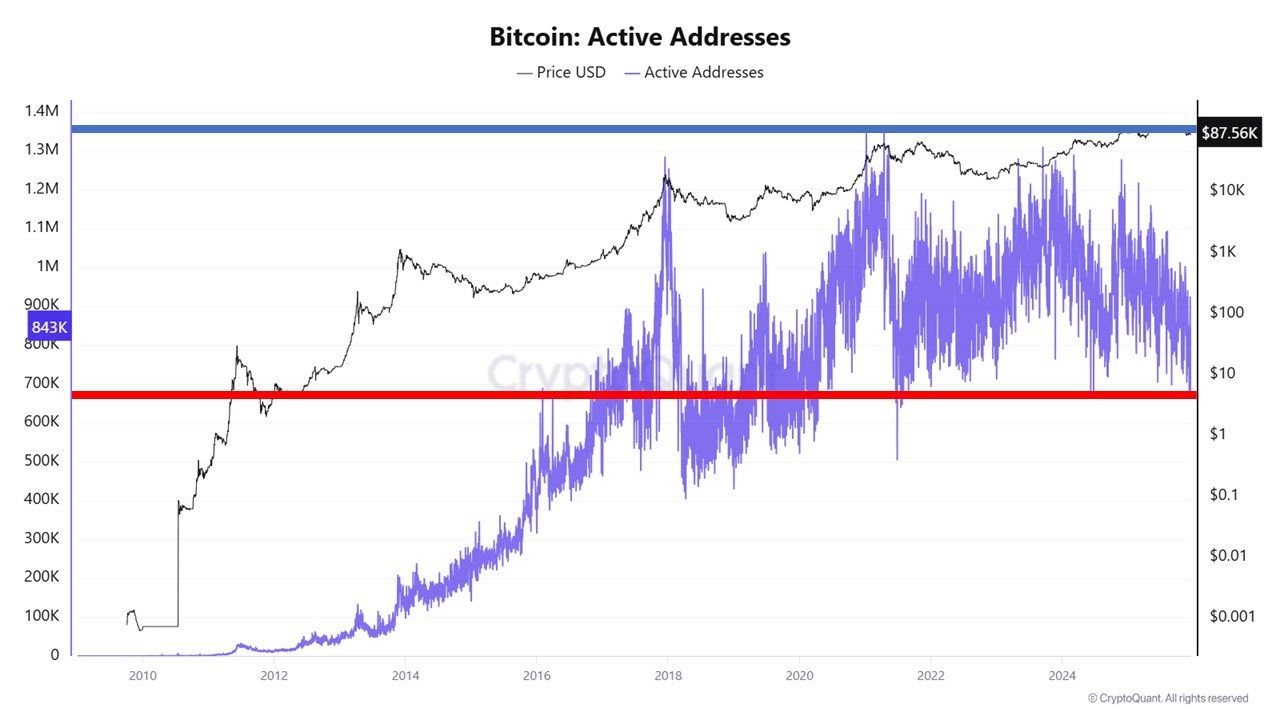
Coin Days Destroyed, or CDD, data raised caution. The 60-day moving average reached 27.6 million, signaling movement of older coins. CryptoQuant stated that this pattern aligns with the distribution behavior of long-term holders.
Miner data told a mixed story. Miner reserves stood near 1.80 million Bitcoin, lower than historical norms. CryptoQuant noted miners continued releasing Bitcoin structurally, despite short-term accumulation signals. The Miner Position Index stood at -0.45, indicating that near-term selling pressure remained muted.
Whale activity reinforced the distribution thesis. The 30-day exchange whale ratio reached 0.46, reflecting elevated large-holder activity. CryptoQuant reported that new whales held unrealized losses of $18 billion, while older whales showed profits near $147 billion.
Total whale holdings declined by 7.89% month-over-month. CryptoQuant said this trend reflected preparation for broader distribution rather than renewed accumulation.
Analysts Split on Near-Term Bitcoin Price Direction
Market commentators remained divided on Bitcoin’s next move. Coin Bureau warned that CryptoQuant data pointed to a confirmed bear market phase. The firm stated that Bitcoin could fall to around $70,000 within three to six months, with a potential low of $56,000 later in 2026.
Daan Crypto Trades offered a shorter-term perspective. He said the Bitcoin price action “went essentially nowhere” for weeks and remained stuck in the mid-range. He added that holiday periods often brought choppy trading rather than decisive moves.
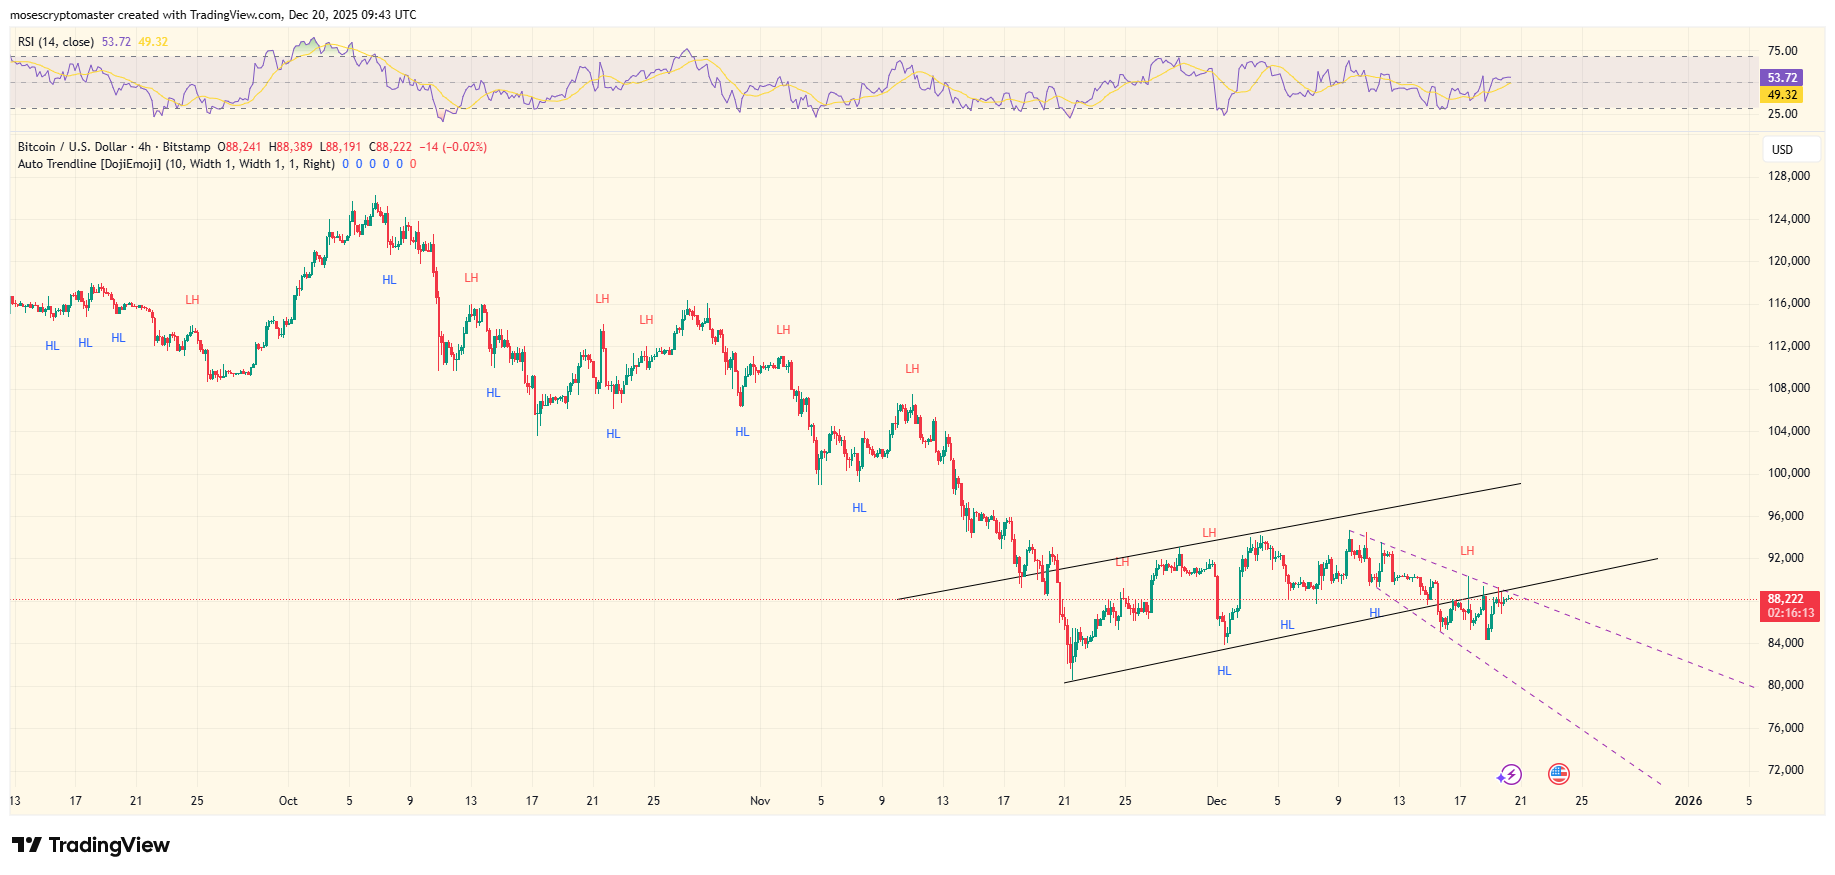
Bitcoin is forming lower highs within an upward-sloping channel. Price recently tested the channel’s lower boundary near $88,000, risking further downside if support failed.
The chart also highlighted repeated lower highs since October. That pattern aligned with broader distribution narratives rather than sustained bullish continuation.
What Comes Next for Bitcoin Price
Bitcoin entered the final weeks of December without a clear catalyst. On-chain data suggested consolidation remained superficial, masking longer-term selling pressure. Analysts agreed that patience, not urgency, defined the current phase.
Key support sat between $85,000 and $88,000, based on recent price reactions. A sustained breakdown below that zone could expose deeper downside toward $80,000. Resistance remained near $92,000, where sellers repeatedly capped rallies.
CryptoQuant said the broader structure resembled pre-distribution within a bear market context. Until MVRV and whale metrics reset, downside risks persisted. Short-term calm did not equal long-term safety.
For now, Bitcoin price stability reflected uncertainty, not conviction. History suggested that true cycle lows rarely arrived quietly.